Starwood 2012 Annual Report Download - page 195
Download and view the complete annual report
Please find page 195 of the 2012 Starwood annual report below. You can navigate through the pages in the report by either clicking on the pages listed below, or by using the keyword search tool below to find specific information within the annual report.-
 1
1 -
2
-
3
-
4
-
5
-
6
-
7
-
8
-
9
-
10
-
11
-
12
-
13
-
14
-
15
-
16
-
17
-
18
-
19
-
20
-
21
-
22
-
23
-
24
-
25
-
26
-
27
-
28
-
29
-
30
-
31
-
32
-
33
-
34
-
35
-
36
-
37
-
38
-
39
-
40
-
41
-
42
-
43
-
44
-
45
-
46
-
47
-
48
-
49
-
50
-
51
-
52
-
53
-
54
-
55
-
56
-
57
-
58
-
59
-
60
-
61
-
62
-
63
-
64
-
65
-
66
-
67
-
68
-
69
-
70
-
71
-
72
-
73
-
74
-
75
-
76
-
77
-
78
-
79
-
80
-
81
-
82
-
83
-
84
-
85
-
86
-
87
-
88
-
89
-
90
-
91
-
92
-
93
-
94
-
95
-
96
-
97
-
98
-
99
-
100
-
101
-
102
-
103
-
104
-
105
-
106
-
107
-
108
-
109
-
110
-
111
-
112
-
113
-
114
-
115
-
116
-
117
-
118
-
119
-
120
-
121
-
122
-
123
-
124
-
125
-
126
-
127
-
128
-
129
-
130
-
131
-
132
-
133
-
134
-
135
-
136
-
137
-
138
-
139
-
140
-
141
-
142
-
143
-
144
-
145
-
146
-
147
-
148
-
149
-
150
-
151
-
152
-
153
-
154
-
155
-
156
-
157
-
158
-
159
-
160
-
161
-
162
-
163
-
164
-
165
-
166
-
167
-
168
-
169
-
170
-
171
-
172
-
173
-
174
-
175
-
176
-
177
-
178
-
179
-
180
-
181
-
182
-
183
-
184
-
 185
185 -
 186
186 -
 187
187 -
 188
188 -
 189
189 -
 190
190 -
 191
191 -
 192
192 -
 193
193 -
 194
194 -
 195
195 -
 196
196 -
 197
197 -
 198
198 -
 199
199 -
 200
200 -
 201
201 -
 202
202 -
 203
203 -
 204
204 -
 205
205 -
206
-
207
-
208
-
209
-
210
 |
 |

STARWOOD HOTELS & RESORTS WORLDWIDE, INC.
NOTES TO FINANCIAL STATEMENTS
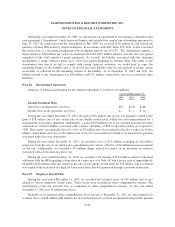
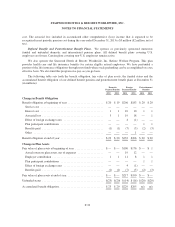
Compensation expense, net of reimbursements during 2012, 2011 and 2010 was approximately $63 million,
$75 million and $72 million, respectively, resulting in tax benefits of $24 million, $29 million and $28 million,
respectively. As of December 31, 2012, there was approximately $69 million of unrecognized compensation cost,
net of estimated forfeitures, including the impact of reimbursement from third parties, which is expected to be
recognized over a weighted-average period of 1.5 years on a straight-line basis.
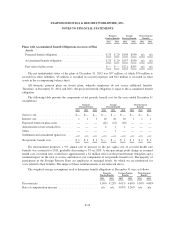
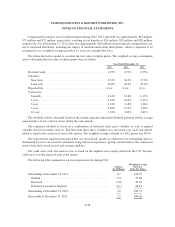
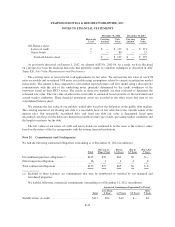
We utilize the Lattice model to calculate the fair value of option grants. The weighted average assumptions
used to determine the fair value of option grants were as follows:
Year Ended December 31,
2012 2011 2010
Dividend yield ....................................... 1.25% 0.75% 0.75%
Volatility:
Near term ......................................... 37.0% 36.0% 37.0%
Long term ......................................... 46.0% 44.0% 45.0%
Expected life ......................................... 6yrs. 6 yrs. 6 yrs.
Yield curve:
6 month ........................................... 0.14% 0.18% 0.19%
1 year ............................................ 0.18% 0.25% 0.32%
3 year ............................................ 0.41% 1.18% 1.36%
5 year ............................................ 0.84% 2.13% 2.30%
10 year ........................................... 1.94% 3.42% 3.61%
The dividend yield is estimated based on the current expected annualized dividend payment and the average
expected price of our common shares during the same periods.
The estimated volatility is based on a combination of historical share price volatility as well as implied
volatility based on market analysis. The historical share price volatility was measured over an 8-year period,
which is equal to the contractual term of the options. The weighted average volatility for 2012 grants was 40.6%.
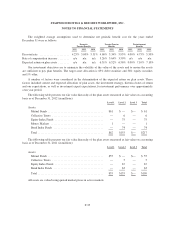
The expected life represents the period that our stock-based awards are expected to be outstanding and was
determined based on an actuarial calculation using historical experience, giving consideration to the contractual
terms of the stock-based awards and vesting schedules.
The yield curve (risk-free interest rate) is based on the implied zero-coupon yield from the U.S. Treasury
yield curve over the expected term of the option.
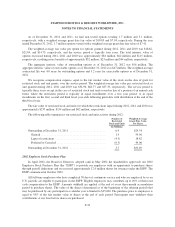
The following table summarizes our stock option activity during 2012:
Options
(In Millions)
Weighted Average
Exercise
Price Per Share
Outstanding at December 31, 2011 ............................ 6.7 $30.70
Granted ............................................... 0.4 55.06
Exercised .............................................. (2.8) 26.38
Forfeited, Canceled or Expired ............................. (0.1) 28.61
Outstanding at December 31, 2012 ............................ 4.2 $35.72
Exercisable at December 31, 2012 ............................ 2.5 $40.06
F-38