Starwood 2012 Annual Report Download - page 141
Download and view the complete annual report
Please find page 141 of the 2012 Starwood annual report below. You can navigate through the pages in the report by either clicking on the pages listed below, or by using the keyword search tool below to find specific information within the annual report.-
 1
1 -
2
-
3
-
4
-
5
-
6
-
7
-
8
-
9
-
10
-
11
-
12
-
13
-
14
-
15
-
16
-
17
-
18
-
19
-
20
-
21
-
22
-
23
-
24
-
25
-
26
-
27
-
28
-
29
-
30
-
31
-
32
-
33
-
34
-
35
-
36
-
37
-
38
-
39
-
40
-
41
-
42
-
43
-
44
-
45
-
46
-
47
-
48
-
49
-
50
-
51
-
52
-
53
-
54
-
55
-
56
-
57
-
58
-
59
-
60
-
61
-
62
-
63
-
64
-
65
-
66
-
67
-
68
-
69
-
70
-
71
-
72
-
73
-
74
-
75
-
76
-
77
-
78
-
79
-
80
-
81
-
82
-
83
-
84
-
85
-
86
-
87
-
88
-
89
-
90
-
91
-
92
-
93
-
94
-
95
-
96
-
97
-
98
-
99
-
100
-
101
-
102
-
103
-
104
-
105
-
106
-
107
-
108
-
109
-
110
-
111
-
112
-
113
-
114
-
115
-
116
-
117
-
118
-
119
-
120
-
121
-
122
-
123
-
124
-
125
-
126
-
127
-
128
-
129
-
130
-
 131
131 -
 132
132 -
 133
133 -
 134
134 -
 135
135 -
 136
136 -
 137
137 -
 138
138 -
 139
139 -
 140
140 -
 141
141 -
 142
142 -
 143
143 -
 144
144 -
 145
145 -
 146
146 -
 147
147 -
 148
148 -
 149
149 -
 150
150 -
 151
151 -
152
-
153
-
154
-
155
-
156
-
157
-
158
-
159
-
160
-
161
-
162
-
163
-
164
-
165
-
166
-
167
-
168
-
169
-
170
-
171
-
172
-
173
-
174
-
175
-
176
-
177
-
178
-
179
-
180
-
181
-
182
-
183
-
184
-
185
-
186
-
187
-
188
-
189
-
190
-
191
-
192
-
193
-
194
-
195
-
196
-
197
-
198
-
199
-
200
-
201
-
202
-
203
-
204
-
205
-
206
-
207
-
208
-
209
-
210
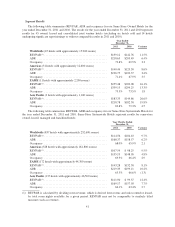
 |
 |

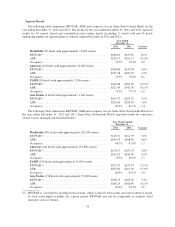
The following tables summarize segment revenues and segment earnings for the year ended December 31,
2011 and 2010.
Segment Revenues
Year Ended
December 31,
2011
Year Ended
December 31,
2010
Increase /
(decrease)
from prior
year
Percentage
change
from prior
year
(in millions)
Americas ............................. $1,630 $1,597 $ 33 2.1%
EAME ................................ 592 529 63 11.9%
Asia Pacific ........................... 303 235 68 28.9%
Vacation ownership and residential ........ 688 526 162 30.8%
Total segment revenues .................. $3,213 $2,887 $326 11.3%
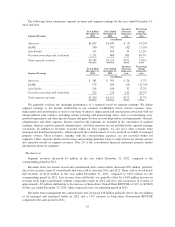
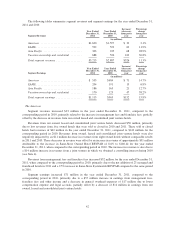
Segment Earnings
Year Ended
December 31,
2011
Year Ended
December 31,
2010
Increase /
(decrease)
from prior
year
Percentage
change
from prior
year
(in millions)
Americas ............................. $ 555 $484 $ 71 14.7%
EAME ................................ 204 191 13 6.8%
Asia Pacific ........................... 186 165 21 12.7%
Vacation ownership and residential ........ 170 123 47 38.2%
Total segment earnings .................. $1,115 $963 $152 15.8%
The Americas
Segment revenues increased $33 million in the year ended December 31, 2011, compared to the
corresponding period in 2010, primarily related to the increase in management fees and franchise fees, partially
offset by the decrease in revenues from our owned leased and consolidated joint venture hotels.
Revenues from our owned, leased and consolidated joint venture hotels decreased $50 million, primarily
due to lost revenues from five owned hotels that were sold or closed in 2010 and 2011. These sold or closed
hotels had revenues of $42 million in the year ended December 31, 2011, compared to $142 million for the
corresponding period in 2010. Revenues from owned, leased and consolidated joint venture hotels were also
negatively impacted by an $11 million decrease in revenues from eight owned hotels without comparable results
in 2011 and 2010. These decreases in revenue were offset by an increase in revenue of approximately $51 million
attributable to the increase in Same-Store Owned Hotel REVPAR of 8.6% to $140.44 for the year ended
December 31, 2011, when compared to the corresponding period in 2010. The increase in revenues is also due to
a $14 million increase in revenues from a joint venture in which we obtained a controlling interest during 2010
(see Note 4).
Revenues from management fees and franchise fees increased $52 million for the year ended December 31,
2011, when compared to the corresponding period in 2010, primarily due to the net addition of 23 managed and
franchised hotels in 2011 and a 9.5% increase in Same-Store Systemwide REVPAR compared to the same period
in 2010.
Segment earnings increased $71 million in the year ended December 31, 2011, compared to the
corresponding period in 2010, primarily due to a $57 million increase in earnings from management fees,
franchise fees and other income and a decrease in general overhead expenses of $17 million due to lower
compensation expense and legal accruals, partially offset by a decrease of $14 million in earnings from our
owned, leased and consolidated joint venture hotels.
42