Starwood 2012 Annual Report Download - page 129
Download and view the complete annual report
Please find page 129 of the 2012 Starwood annual report below. You can navigate through the pages in the report by either clicking on the pages listed below, or by using the keyword search tool below to find specific information within the annual report.-
 1
1 -
2
-
3
-
4
-
5
-
6
-
7
-
8
-
9
-
10
-
11
-
12
-
13
-
14
-
15
-
16
-
17
-
18
-
19
-
20
-
21
-
22
-
23
-
24
-
25
-
26
-
27
-
28
-
29
-
30
-
31
-
32
-
33
-
34
-
35
-
36
-
37
-
38
-
39
-
40
-
41
-
42
-
43
-
44
-
45
-
46
-
47
-
48
-
49
-
50
-
51
-
52
-
53
-
54
-
55
-
56
-
57
-
58
-
59
-
60
-
61
-
62
-
63
-
64
-
65
-
66
-
67
-
68
-
69
-
70
-
71
-
72
-
73
-
74
-
75
-
76
-
77
-
78
-
79
-
80
-
81
-
82
-
83
-
84
-
85
-
86
-
87
-
88
-
89
-
90
-
91
-
92
-
93
-
94
-
95
-
96
-
97
-
98
-
99
-
100
-
101
-
102
-
103
-
104
-
105
-
106
-
107
-
108
-
109
-
110
-
111
-
112
-
113
-
114
-
115
-
116
-
117
-
118
-
 119
119 -
 120
120 -
 121
121 -
 122
122 -
 123
123 -
 124
124 -
 125
125 -
 126
126 -
 127
127 -
 128
128 -
 129
129 -
 130
130 -
 131
131 -
 132
132 -
 133
133 -
 134
134 -
 135
135 -
 136
136 -
 137
137 -
 138
138 -
 139
139 -
140
-
141
-
142
-
143
-
144
-
145
-
146
-
147
-
148
-
149
-
150
-
151
-
152
-
153
-
154
-
155
-
156
-
157
-
158
-
159
-
160
-
161
-
162
-
163
-
164
-
165
-
166
-
167
-
168
-
169
-
170
-
171
-
172
-
173
-
174
-
175
-
176
-
177
-
178
-
179
-
180
-
181
-
182
-
183
-
184
-
185
-
186
-
187
-
188
-
189
-
190
-
191
-
192
-
193
-
194
-
195
-
196
-
197
-
198
-
199
-
200
-
201
-
202
-
203
-
204
-
205
-
206
-
207
-
208
-
209
-
210
 |
 |

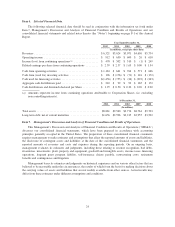
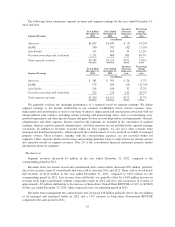
REVPAR at our worldwide Same-Store Owned Hotels was $160.01 for the year ended December 31, 2012,
compared to $159.85 in the corresponding period in 2011. The slight increase in REVPAR at these worldwide
Same-Store Owned Hotels resulted from an increase in occupancy rates to 72.5% for the year ended
December 31, 2012, compared to 72.3% in the corresponding period in 2011, partially offset by a 0.2% decrease
in ADR to $220.71 for the year ended December 31, 2012, compared to $221.17 for the corresponding period in
2011. While REVPAR growth was particularly strong at our owned hotels in San Francisco, California, Mexico
City, Mexico and Rio de Janeiro, Brazil, the growth was substantially offset by decreases in REVPAR at our
owned hotels in Montreal, Canada, Buenos Aires, Argentina and various cities in Italy.
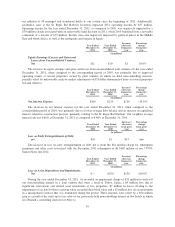
The increase in management fees, franchise fees and other income was primarily a result of an $89 million
increase in management fees and franchise fees to $861 million for the year ended December 31, 2012, compared
to $772 million for the corresponding period in 2011. Management fees increased 11.9% to $509 million and
franchise fees increased 7.0% to $200 million. These increases were primarily due to the net addition of 48
managed and franchised hotels to our system in 2012 and a 3.2% increase in Worldwide Systemwide REVPAR,
compared to the same period in 2011. Other income for the year ended December 31, 2012 decreased $15 million
when compared to the corresponding period in 2011, primarily as a result of payments received, in 2011, on
promissory notes that had previously been reserved.
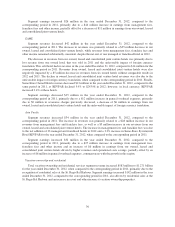
Total vacation ownership and residential revenue increased $584 million to $1.287 billion for the year ended
December 31, 2012, when compared to the corresponding period in 2011, primarily due to the recognition of
residential sales at the St. Regis Bal Harbour. In late 2011, we received the certificate of occupancy for this
project and began contract closings and, during the year ended December 31, 2012, we closed sales of 188 units.
We realized revenues of $684 million during the year ended December 31, 2012 compared to realized revenues
of $122 million for the year ended December 31, 2011. From project inception through December 31, 2012, we
have closed contracts and recognized revenue on 224 units representing approximately 73% of the total
residential units.
Vacation ownership revenues for the year ended December 31, 2012 increased 3.7% to $587 million,
compared to the corresponding period in 2011, primarily due to increased revenues from resort operations.
Originated contract sales of VOI inventory decreased 1.8% in the year ended December 31, 2012, when
compared to the corresponding period in 2011, primarily due to a lower average price per contract and lower
closing efficiency, partially offset by an increase in tour flow. The number of contracts signed decreased 0.9%
when compared to 2011 and the average contract amount per vacation ownership unit sold decreased 0.9% to
approximately $14,800, driven by inventory mix.
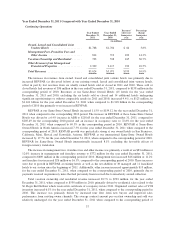
Other revenues from managed and franchised properties increased primarily due to an increase in payroll
costs commensurate with increased occupancy at our existing managed hotels and payroll costs for the new
hotels entering the system. These revenues represent reimbursements of costs incurred on behalf of managed
hotel and vacation ownership properties and franchisees and relate primarily to payroll costs at managed
properties where we are the employer. Since the reimbursements are made based upon the costs incurred with no
added margin, these revenues and corresponding expenses have no effect on our operating income or our net
income.
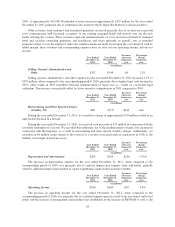
Year Ended
December 31,
2012
Year Ended
December 31,
2011
Increase /
(decrease)
from prior
year
Percentage
change
from prior
year
(in millions)
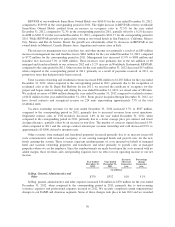
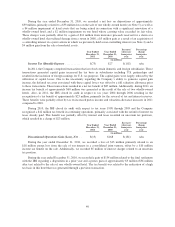
Selling, General, Administrative and
Other .............................. $370 $352 $18 5.1%
Selling, general, administrative and other expenses increased $18 million to $370 million for the year ended
December 31, 2012, when compared to the corresponding period in 2011, primarily due to non-recurring
severance expenses and professional expenses incurred in 2012. We recently completed certain organizational
changes to our EAME and Americas segments. Some of those changes took place in late 2012 and we recorded
30