Starwood 2012 Annual Report Download - page 50
Download and view the complete annual report
Please find page 50 of the 2012 Starwood annual report below. You can navigate through the pages in the report by either clicking on the pages listed below, or by using the keyword search tool below to find specific information within the annual report.-
 1
1 -
2
-
3
-
4
-
5
-
6
-
7
-
8
-
9
-
10
-
11
-
12
-
13
-
14
-
15
-
16
-
17
-
18
-
19
-
20
-
21
-
22
-
23
-
24
-
25
-
26
-
27
-
28
-
29
-
30
-
31
-
32
-
33
-
34
-
35
-
36
-
37
-
38
-
39
-
 40
40 -
 41
41 -
 42
42 -
 43
43 -
 44
44 -
 45
45 -
 46
46 -
 47
47 -
 48
48 -
 49
49 -
 50
50 -
 51
51 -
 52
52 -
 53
53 -
 54
54 -
 55
55 -
 56
56 -
 57
57 -
 58
58 -
 59
59 -
 60
60 -
61
-
62
-
63
-
64
-
65
-
66
-
67
-
68
-
69
-
70
-
71
-
72
-
73
-
74
-
75
-
76
-
77
-
78
-
79
-
80
-
81
-
82
-
83
-
84
-
85
-
86
-
87
-
88
-
89
-
90
-
91
-
92
-
93
-
94
-
95
-
96
-
97
-
98
-
99
-
100
-
101
-
102
-
103
-
104
-
105
-
106
-
107
-
108
-
109
-
110
-
111
-
112
-
113
-
114
-
115
-
116
-
117
-
118
-
119
-
120
-
121
-
122
-
123
-
124
-
125
-
126
-
127
-
128
-
129
-
130
-
131
-
132
-
133
-
134
-
135
-
136
-
137
-
138
-
139
-
140
-
141
-
142
-
143
-
144
-
145
-
146
-
147
-
148
-
149
-
150
-
151
-
152
-
153
-
154
-
155
-
156
-
157
-
158
-
159
-
160
-
161
-
162
-
163
-
164
-
165
-
166
-
167
-
168
-
169
-
170
-
171
-
172
-
173
-
174
-
175
-
176
-
177
-
178
-
179
-
180
-
181
-
182
-
183
-
184
-
185
-
186
-
187
-
188
-
189
-
190
-
191
-
192
-
193
-
194
-
195
-
196
-
197
-
198
-
199
-
200
-
201
-
202
-
203
-
204
-
205
-
206
-
207
-
208
-
209
-
210
 |
 |

STARWOOD HOTELS & RESORTS WORLDWIDE, INC.-2013Proxy Statement44
EXECUTIVE COMPENSATION
executive for 2012. When the threshold was established at the
beginning of 2012, the achievement of the threshold was considered
substantially uncertain for purposes of Section162(m), which is one
of the requirements for compensation paid under the Executive
Plan to be deductible as performance-based compensation under
Section162(m). For 2012, the EP Threshold was $880,000,000.
Under the 2012 program, each participating named executive
offi cer could receive payment of an incentive award under the
Executive Plan only if he remained employed by us on the award
payment date in 2013. However, subject to attaining the EP
Threshold for 2012, pro- rata awards could be paid at the discretion
of the Compensation Committee in the event of death, disability,
retirement or other termination of employment.
Once the EP Threshold was achieved, the maximum annual incentive
amount specifi ed in the Executive Plan became available for each
participating named executive offi cer and the Compensation
Committee applied its discretion to reduce such amount to determine
the actual incentive amount for each individual. To determine the
actual bonus to be paid for 2012 under the Executive Plan, the
Compensation Committee established specifi c annual company
fi nancial and strategic/operational/leadership performance goals and
a related target incentive amount for each participating executive
(plus a maximum payout level for each participating named executive
offi cer despite the maximum annual incentive amount specifi ed
in the Executive Plan). These fi nancial and strategic/operational/
leadership goals are described below.
Additional Performance Criteria
Since the EP Threshold under the Executive Plan was met for 2012, our
performance in comparison to the fi nancial and strategic/operational
/
leadership
goals for the year set by the Compensation Committee
was then used to determine each
participating
named executive
offi cer’s actual incentive payout, as follows:
Financial Goals
Our fi nancial goals for our named executive offi cers under the
Executive Plan consisted of EBITDA and EPS goals, with each criteria
accounting for half of the fi nancial goal portion of the annual incentive
awards. We deemed EBITDA and EPS to be the most appropriate
metrics to measure performance and we have consistently used
these metrics since 2009. As the Compensation Committee generally
sets target incentive award opportunities above the median and
monitors awards around the median, among our peer group, our
fi nancial and strategic/operational/leadership goals to achieve such
award levels are considered challenging but achievable, representing
requirements for a superior level of performance. Consistent with
maintaining these high standards and subject to achieving the EP
Threshold, the Compensation Committee retained the ability to
consider whether an adjustment of the fi nancial goals for 2012
was necessitated by exceptional circumstances (as examples, a
restructuring of the Company or unanticipated accounting changes).
Performance against the fi nancial goals determined 75% of
participating named executive offi cers’ total target annual incentive
payout, with the remaining 25% based on strategic/operational/
leadership goals achievement. Once the EP Threshold was
achieved, actual incentives paid to participating named executive
offi cers for fi nancial performance could have ranged from 0% to
200% of the pre-determined target incentive opportunities for this
category of performance, as determined by the Compensation
Committee. For our participating named executive offi cers, the
company fi nancial performance portion was based 50% on EPS
and 50% on our EBITDA. The overall cap on the plan is 200%.
As noted above, since the EP Threshold was achieved for 2012, the
minimum and maximum annual incentive amount specifi ed in the
Executive Plan became available for award. The maximum incentive
payout for the applicable company fi nancial performance metric
was limited to 200% of target (or maximum) and the Compensation
Committee could apply its discretion to reduce such amount to the
actual bonus amount for each
participating
named executive offi cer.
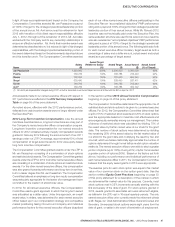
The table below sets forth for each metric the performance levels for
2012 which would have resulted in 100% annual incentive payout
(or target), the minimum performance level (or minimum) that would
have resulted in a 40% annual incentive payout and the maximum that
would have resulted in a 200% annual incentive payout. In addition,
the table sets forth the approximate mid-points of potential payouts
between the minimum to target and target to maximum opportunities
and indicates the related required performance level:
Minimum
(40%) Mid-point
(70%) Target
(100%) Mid-point
(150%) Maximum
(200%)
Earnings per share $ 1.36 $ 1.76 $ 2.16 $ 2.83 $ 3.49
Company EBITDA $ 880,000,000 $ 990,000,000 $ 1,100,000,000 $ 1,283,500,000 $ 1,467,000,000
For the 2012 performance period, “adjusted” EBITDA (which
exceeded the EP Threshold) for purposes of determining annual
bonuses was $1,081,000,000 (or 98% of target). EBITDA was
adjusted to exclude the impact of asset sales and changes in foreign
exchange rates versus budgeted amounts. EPS from continuing
operations for 2012 for annual incentive purposes was $2.02 (or
94% of target), which excludes tax benefi ts related to non-core
items partially offset by restructuring, goodwill impairment and
other special charges and debt extinguishment charges. Using the
metrics described above resulted in a payout eligibility of 92% of
target for the company fi nancial portion of the annual incentives for
the 2012 fi scal year for the participating named executive offi cers.
Strategic/Operational/Leadership Goals
The strategic/operational/leadership performance goals for our
named executive offi cers under the Executive Plan for 2012
consisted of “Big 5” and leadership competency objectives that
link individual contributions to execution of our business strategy
and major fi nancial and operating goals. “Big 5” refers to each
participating executive’s specifi c deliverables within our critical
performance categories— (1) win with talent, (2) execute brilliantly,
(3) build great brands, (4) deliver global growth, and (5) drive
outstanding results. As part of a structured process that cascades
down throughout the company, these objectives were developed
at the beginning of 2012, and they integrated and aligned each