Starwood 2012 Annual Report Download - page 163
Download and view the complete annual report
Please find page 163 of the 2012 Starwood annual report below. You can navigate through the pages in the report by either clicking on the pages listed below, or by using the keyword search tool below to find specific information within the annual report.-
 1
1 -
2
-
3
-
4
-
5
-
6
-
7
-
8
-
9
-
10
-
11
-
12
-
13
-
14
-
15
-
16
-
17
-
18
-
19
-
20
-
21
-
22
-
23
-
24
-
25
-
26
-
27
-
28
-
29
-
30
-
31
-
32
-
33
-
34
-
35
-
36
-
37
-
38
-
39
-
40
-
41
-
42
-
43
-
44
-
45
-
46
-
47
-
48
-
49
-
50
-
51
-
52
-
53
-
54
-
55
-
56
-
57
-
58
-
59
-
60
-
61
-
62
-
63
-
64
-
65
-
66
-
67
-
68
-
69
-
70
-
71
-
72
-
73
-
74
-
75
-
76
-
77
-
78
-
79
-
80
-
81
-
82
-
83
-
84
-
85
-
86
-
87
-
88
-
89
-
90
-
91
-
92
-
93
-
94
-
95
-
96
-
97
-
98
-
99
-
100
-
101
-
102
-
103
-
104
-
105
-
106
-
107
-
108
-
109
-
110
-
111
-
112
-
113
-
114
-
115
-
116
-
117
-
118
-
119
-
120
-
121
-
122
-
123
-
124
-
125
-
126
-
127
-
128
-
129
-
130
-
131
-
132
-
133
-
134
-
135
-
136
-
137
-
138
-
139
-
140
-
141
-
142
-
143
-
144
-
145
-
146
-
147
-
148
-
149
-
150
-
151
-
152
-
 153
153 -
 154
154 -
 155
155 -
 156
156 -
 157
157 -
 158
158 -
 159
159 -
 160
160 -
 161
161 -
 162
162 -
 163
163 -
 164
164 -
 165
165 -
 166
166 -
 167
167 -
 168
168 -
 169
169 -
 170
170 -
 171
171 -
 172
172 -
 173
173 -
174
-
175
-
176
-
177
-
178
-
179
-
180
-
181
-
182
-
183
-
184
-
185
-
186
-
187
-
188
-
189
-
190
-
191
-
192
-
193
-
194
-
195
-
196
-
197
-
198
-
199
-
200
-
201
-
202
-
203
-
204
-
205
-
206
-
207
-
208
-
209
-
210
 |
 |

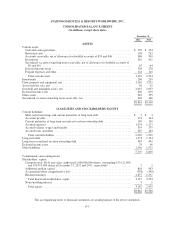
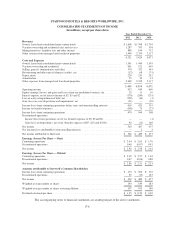
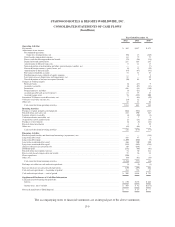
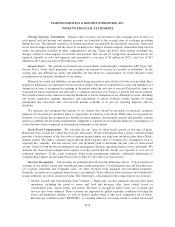
STARWOOD HOTELS & RESORTS WORLDWIDE, INC.
CONSOLIDATED STATEMENTS OF INCOME
(In millions, except per share data)
Year Ended December 31,
2012 2011 2010
Revenues
Owned, leased and consolidated joint venture hotels .................................. $1,698 $ 1,768 $ 1,704
Vacation ownership and residential sales and services ................................. 1,287 703 538
Management fees, franchise fees and other income .................................... 888 814 712
Other revenues from managed and franchised properties ............................... 2,448 2,339 2,117
6,321 5,624 5,071
Costs and Expenses
Owned, leased and consolidated joint venture hotels .................................. 1,391 1,449 1,395
Vacation ownership and residential ................................................ 961 521 405
Selling, general, administrative and other ........................................... 370 352 344
Restructuring and other special charges (credits), net .................................. (12) 68 (75)
Depreciation .................................................................. 226 235 252
Amortization .................................................................. 25 30 33
Other expenses from managed and franchised properties ............................... 2,448 2,339 2,117
5,409 4,994 4,471
Operating income .............................................................. 912 630 600
Equity earnings (losses) and gains and losses from unconsolidated ventures, net ............ 25 11 10
Interest expense, net of interest income of $2, $3 and $2 ............................... (170) (200) (235)
Loss on early extinguishment of debt, net ........................................... (128) (16) (1)
Gain (loss) on asset dispositions and impairments, net ................................. (21) — (39)
Income (loss) from continuing operations before taxes and noncontrolling interests .......... 618 425 335
Income tax benefit (expense) ..................................................... (148) 75 (27)
Income (loss) from continuing operations ........................................... 470 500 308
Discontinued operations:
Income (loss) from operations, net of tax (benefit) expense of $0, $0 and $0 .............. — — (1)
Gain (loss) on dispositions, net of tax (benefit) expense of $87, $(5) and $(166) ........... 92 (13) 168
Net income ................................................................... 562 487 475
Net (income) loss attributable to noncontrolling interests ............................... — 2 2
Net income attributable to Starwood ............................................... $ 562 $ 489 $ 477
Earnings (Losses) Per Share — Basic
Continuing operations .......................................................... $ 2.44 $ 2.65 $ 1.70
Discontinued operations ......................................................... 0.48 (0.07) 0.91
Net income ................................................................... $ 2.92 $ 2.58 $ 2.61
Earnings (Losses) Per Share — Diluted
Continuing operations .......................................................... $ 2.39 $ 2.57 $ 1.63
Discontinued operations ......................................................... 0.47 (0.06) 0.88
Net income ................................................................... $ 2.86 $ 2.51 $ 2.51
Amounts attributable to Starwood’s Common Shareholders
Income (loss) from continuing operations ........................................... $ 470 $ 502 $ 310
Discontinued operations ......................................................... 92 (13) 167
Net income ................................................................... $ 562 $ 489 $ 477
Weighted average number of shares ............................................... 193 189 183
Weighted average number of shares assuming dilution ................................. 197 195 190
Dividends declared per share ..................................................... $ 1.25 $ 0.50 $ 0.30
The accompanying notes to financial statements are an integral part of the above statements.
F-6