Starwood 2012 Annual Report Download - page 146
Download and view the complete annual report
Please find page 146 of the 2012 Starwood annual report below. You can navigate through the pages in the report by either clicking on the pages listed below, or by using the keyword search tool below to find specific information within the annual report.-
 1
1 -
2
-
3
-
4
-
5
-
6
-
7
-
8
-
9
-
10
-
11
-
12
-
13
-
14
-
15
-
16
-
17
-
18
-
19
-
20
-
21
-
22
-
23
-
24
-
25
-
26
-
27
-
28
-
29
-
30
-
31
-
32
-
33
-
34
-
35
-
36
-
37
-
38
-
39
-
40
-
41
-
42
-
43
-
44
-
45
-
46
-
47
-
48
-
49
-
50
-
51
-
52
-
53
-
54
-
55
-
56
-
57
-
58
-
59
-
60
-
61
-
62
-
63
-
64
-
65
-
66
-
67
-
68
-
69
-
70
-
71
-
72
-
73
-
74
-
75
-
76
-
77
-
78
-
79
-
80
-
81
-
82
-
83
-
84
-
85
-
86
-
87
-
88
-
89
-
90
-
91
-
92
-
93
-
94
-
95
-
96
-
97
-
98
-
99
-
100
-
101
-
102
-
103
-
104
-
105
-
106
-
107
-
108
-
109
-
110
-
111
-
112
-
113
-
114
-
115
-
116
-
117
-
118
-
119
-
120
-
121
-
122
-
123
-
124
-
125
-
126
-
127
-
128
-
129
-
130
-
131
-
132
-
133
-
134
-
135
-
 136
136 -
 137
137 -
 138
138 -
 139
139 -
 140
140 -
 141
141 -
 142
142 -
 143
143 -
 144
144 -
 145
145 -
 146
146 -
 147
147 -
 148
148 -
 149
149 -
 150
150 -
 151
151 -
 152
152 -
 153
153 -
 154
154 -
 155
155 -
 156
156 -
157
-
158
-
159
-
160
-
161
-
162
-
163
-
164
-
165
-
166
-
167
-
168
-
169
-
170
-
171
-
172
-
173
-
174
-
175
-
176
-
177
-
178
-
179
-
180
-
181
-
182
-
183
-
184
-
185
-
186
-
187
-
188
-
189
-
190
-
191
-
192
-
193
-
194
-
195
-
196
-
197
-
198
-
199
-
200
-
201
-
202
-
203
-
204
-
205
-
206
-
207
-
208
-
209
-
210
 |
 |

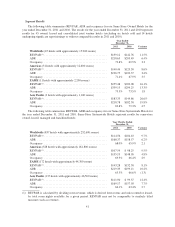
During the twelve months ended December 31, 2012, we repurchased 6.3 million common shares at an
average price of $50.83 for a total cost of approximately $320 million (see Note 21).
In December 2012, we issued $350 million of 3.125% Senior Notes, which will mature in February 2023.
We used the net proceeds from the offering, together with cash on hand, to finance the December 2012
Redemptions.
During the year ended December 31, 2012, we completed a securitization of approximately $174 million of
vacation ownership notes receivable. The securitization transaction did not qualify as a sale for accounting
purposes and, accordingly, no gain or loss was recognized and the proceeds are presented as debt. Of the
$174 million securitized in 2012, $155 million was previously unsecuritized and approximately $19 million
related to the 2005 securitization for which the termination was prefunded. The net cash proceeds from the
securitization, after the amount pre-funded for the future termination of the 2005 securitization and associated
deal costs, were approximately $140 million (see Note 10). The pre-funded amount of $18 million is included in
restricted cash until the 2005 securitization is terminated, which is expected to occur in 2013.
In November 2012, we closed on a new $1.75 billion senior credit facility (the “New Facility”) to replace
the existing $1.5 billion credit agreement (the “Existing Facility”). The New Facility matures in February 2018,
whereas the Existing Facility was scheduled to mature in November 2013. The New Facility is a multi-currency
revolving loan commitment and is expected to be used for general corporate purposes. We have evaluated the
commitments of each of the lenders in our New Facility, and we have reviewed our debt covenants and do not
anticipate any issues regarding the availability of funds under the New Facility.
In December 2011, we redeemed all $605 million of our 7.875% Senior Notes outstanding, which were
originally issued in April 2002 and due May 2012. We paid $628 million in connection with the redemptions and
recorded a charge of approximately $16 million, representing the call premiums, and other related redemption
costs.
During 2011, we completed the securitization of vacation ownership receivables resulting in net proceeds of
approximately $177 million.
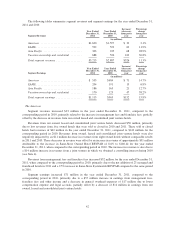
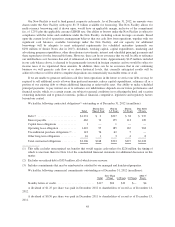
December 31,
2012
December 31,
2011
(in millions)
Gross Unsecuritized Debt ...................................... $1,275 $2,197
less: cash (including restricted cash of $123 million in 2012 and $212
million in 2011) ........................................... (428) (666)
Net Unsecuritized Debt ........................................ $ 847 $1,531
Gross Securitized Debt (non-recourse) ........................... $ 533 $ 532
less: cash restricted for securitized debt repayments (not included
above) .................................................. (41) (22)
Net Securitized Debt .......................................... $ 492 $ 510
Total Net Debt ............................................... $1,339 $2,041
The cost of borrowing under the New Facility is determined by a combination of our leverage ratios and
credit ratings. Changes in our credit ratings may result in changes in our borrowing costs. Downgrades in our
credit ratings would likely increase the relative costs of borrowing and reduce our ability to issue long-term debt,
whereas upgrades would likely reduce costs and increase our ability to issue long-term debt. A credit rating is not
a recommendation to buy, sell or hold securities, is subject to revision or withdrawal at any time by the assigning
rating organization and should be evaluated independently of any other rating. During the three months ended
March 31, 2012, we were upgraded to investment grade by all three rating agencies. We were subsequently
upgraded one additional ratings notch by all three rating agencies during the year ended December 31, 2012.
47