Starwood 2012 Annual Report Download - page 199
Download and view the complete annual report
Please find page 199 of the 2012 Starwood annual report below. You can navigate through the pages in the report by either clicking on the pages listed below, or by using the keyword search tool below to find specific information within the annual report.-
 1
1 -
2
-
3
-
4
-
5
-
6
-
7
-
8
-
9
-
10
-
11
-
12
-
13
-
14
-
15
-
16
-
17
-
18
-
19
-
20
-
21
-
22
-
23
-
24
-
25
-
26
-
27
-
28
-
29
-
30
-
31
-
32
-
33
-
34
-
35
-
36
-
37
-
38
-
39
-
40
-
41
-
42
-
43
-
44
-
45
-
46
-
47
-
48
-
49
-
50
-
51
-
52
-
53
-
54
-
55
-
56
-
57
-
58
-
59
-
60
-
61
-
62
-
63
-
64
-
65
-
66
-
67
-
68
-
69
-
70
-
71
-
72
-
73
-
74
-
75
-
76
-
77
-
78
-
79
-
80
-
81
-
82
-
83
-
84
-
85
-
86
-
87
-
88
-
89
-
90
-
91
-
92
-
93
-
94
-
95
-
96
-
97
-
98
-
99
-
100
-
101
-
102
-
103
-
104
-
105
-
106
-
107
-
108
-
109
-
110
-
111
-
112
-
113
-
114
-
115
-
116
-
117
-
118
-
119
-
120
-
121
-
122
-
123
-
124
-
125
-
126
-
127
-
128
-
129
-
130
-
131
-
132
-
133
-
134
-
135
-
136
-
137
-
138
-
139
-
140
-
141
-
142
-
143
-
144
-
145
-
146
-
147
-
148
-
149
-
150
-
151
-
152
-
153
-
154
-
155
-
156
-
157
-
158
-
159
-
160
-
161
-
162
-
163
-
164
-
165
-
166
-
167
-
168
-
169
-
170
-
171
-
172
-
173
-
174
-
175
-
176
-
177
-
178
-
179
-
180
-
181
-
182
-
183
-
184
-
185
-
186
-
187
-
188
-
 189
189 -
 190
190 -
 191
191 -
 192
192 -
 193
193 -
 194
194 -
 195
195 -
 196
196 -
 197
197 -
 198
198 -
 199
199 -
 200
200 -
 201
201 -
 202
202 -
 203
203 -
 204
204 -
 205
205 -
 206
206 -
 207
207 -
 208
208 -
 209
209 -
210
 |
 |

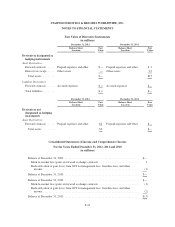
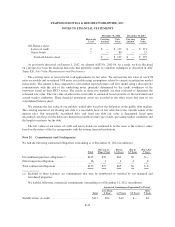
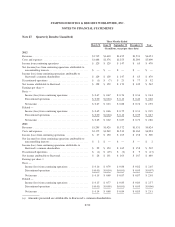
STARWOOD HOTELS & RESORTS WORLDWIDE, INC.
NOTES TO FINANCIAL STATEMENTS
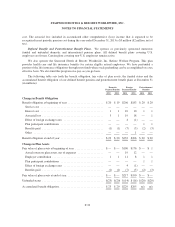
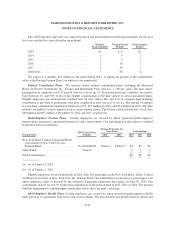
Balance at December 31, 2011 .................................................... $(3)
Mark-to-market loss (gain) on forward exchange contracts ............................ —
Reclassification of gain (loss) from OCI to management fees, franchise fees, and other
income ................................................................... 4
Balance at December 31, 2012 .................................................... $ 1
Derivatives Not Designated as Hedging
Instruments
Location of Gain or (Loss) Recognized
in Income on Derivative
Amount of Gain or
(Loss) Recognized in
Income on Derivative
Year Ended
December 31,
2012 2011 2010
Foreign forward exchange contracts ....... Interest expense, net $(1) $5 $(45)
Total (loss) gain included in income ....... $(1) $5 $(45)
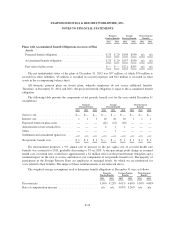
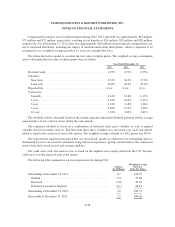
Note 24. Fair Value of Financial Instruments
The following table presents our fair value hierarchy for our financial assets and liabilities measured at fair
value on a recurring basis as of December 31, 2012 (in millions):
Level 1 Level 2 Level 3 Total
Assets:
Forward contracts .................................... $— $2 $— $2
Liabilities:
Forward contracts .................................... $— $1 $— $1
The forward contracts are over the counter contracts that do not trade on a public exchange. The fair values
of the contracts are classified as Level 2 since they are based on inputs such as foreign currency spot rates and
forward points that are readily available on public markets. We consider both our credit risk, as well as our
counterparties’ credit risk in determining fair value and we did not make an adjustment as it was deemed
insignificant based on the short duration of the contracts and our rate of short-term debt.
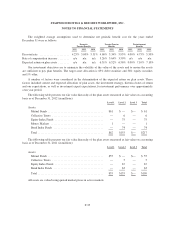
We believe the carrying values of our financial instruments related to current assets and liabilities
approximate fair value. The following table presents the carrying amounts and estimated fair values of our long-
term financial instruments (in millions):
December 31, 2012 December 31, 2011
Hierarchy
Level
Carrying
Amount
Fair
Value
Carrying
Amount
Fair
Value
Assets:
Restricted cash ....................... 1 $ 6 $ 6 $ 2 $ 2
VOI notes receivable .................. 3 92 113 93 109
Securitized vacation ownership notes
receivable ......................... 3 438 558 446 551
Other notes receivable ................. 3 11 11 26 26
Total financial assets ................ $ 547 $ 688 $ 567 $ 688
Liabilities:
Long-term debt ....................... 1 $1,273 $1,447 $2,194 $2,442
Long-term securitized debt ............. 3 383 402 402 412
Total financial liabilities ............. $1,656 $1,849 $2,596 $2,854
F-42