Starwood 2012 Annual Report Download - page 196
Download and view the complete annual report
Please find page 196 of the 2012 Starwood annual report below. You can navigate through the pages in the report by either clicking on the pages listed below, or by using the keyword search tool below to find specific information within the annual report.-
 1
1 -
2
-
3
-
4
-
5
-
6
-
7
-
8
-
9
-
10
-
11
-
12
-
13
-
14
-
15
-
16
-
17
-
18
-
19
-
20
-
21
-
22
-
23
-
24
-
25
-
26
-
27
-
28
-
29
-
30
-
31
-
32
-
33
-
34
-
35
-
36
-
37
-
38
-
39
-
40
-
41
-
42
-
43
-
44
-
45
-
46
-
47
-
48
-
49
-
50
-
51
-
52
-
53
-
54
-
55
-
56
-
57
-
58
-
59
-
60
-
61
-
62
-
63
-
64
-
65
-
66
-
67
-
68
-
69
-
70
-
71
-
72
-
73
-
74
-
75
-
76
-
77
-
78
-
79
-
80
-
81
-
82
-
83
-
84
-
85
-
86
-
87
-
88
-
89
-
90
-
91
-
92
-
93
-
94
-
95
-
96
-
97
-
98
-
99
-
100
-
101
-
102
-
103
-
104
-
105
-
106
-
107
-
108
-
109
-
110
-
111
-
112
-
113
-
114
-
115
-
116
-
117
-
118
-
119
-
120
-
121
-
122
-
123
-
124
-
125
-
126
-
127
-
128
-
129
-
130
-
131
-
132
-
133
-
134
-
135
-
136
-
137
-
138
-
139
-
140
-
141
-
142
-
143
-
144
-
145
-
146
-
147
-
148
-
149
-
150
-
151
-
152
-
153
-
154
-
155
-
156
-
157
-
158
-
159
-
160
-
161
-
162
-
163
-
164
-
165
-
166
-
167
-
168
-
169
-
170
-
171
-
172
-
173
-
174
-
175
-
176
-
177
-
178
-
179
-
180
-
181
-
182
-
183
-
184
-
185
-
 186
186 -
 187
187 -
 188
188 -
 189
189 -
 190
190 -
 191
191 -
 192
192 -
 193
193 -
 194
194 -
 195
195 -
 196
196 -
 197
197 -
 198
198 -
 199
199 -
 200
200 -
 201
201 -
 202
202 -
 203
203 -
 204
204 -
 205
205 -
 206
206 -
207
-
208
-
209
-
210
 |
 |

STARWOOD HOTELS & RESORTS WORLDWIDE, INC.
NOTES TO FINANCIAL STATEMENTS
As of December 31, 2012 and 2011, we had non-vested options totaling 1.7 million and 3.1 million,
respectively, with a weighted average grant date fair value of $10.85 and $7.94, respectively. During the year
ended December 31, 2012, 1.7 million options vested with a weighted average grant date fair value of $7.41.
The weighted-average fair value per option for options granted during 2012, 2011 and 2010 was $18.62,
$21.84, and $14.73, respectively, and the service period is typically four years. The total intrinsic value of
options exercised during 2012, 2011 and 2010 was approximately $84 million, $62 million and $115 million,
respectively, resulting in tax benefits of approximately $32 million, $23 million and $44 million, respectively.
The aggregate intrinsic value of outstanding options as of December 31, 2012 was $96 million. The
aggregate intrinsic value of exercisable options as of December 31, 2012 was $47 million. The weighted-average
contractual life was 4.0 years for outstanding options and 3.2 years for exercisable options as of December 31,
2012.
We recognize compensation expense, equal to the fair market value of the stock on the date of grant for
restricted stock and unit grants, over the service period. The weighted-average fair value per restricted stock or
unit granted during 2012, 2011 and 2010 was $54.96, $60.77 and $37.33, respectively. The service period is
typically three years except in the case of restricted stock and units issued in lieu of a portion of an annual cash
bonus where the restriction period is typically in equal installments over a two year period, or in equal
installments on the first, second and third fiscal year ends following grant date with distribution at the end of the
third fiscal year.
The fair value of restricted stock and units for which the restrictions lapsed during 2012, 2011 and 2010 was
approximately $237 million, $154 million and $62 million, respectively.
The following table summarizes our restricted stock and units activity during 2012:
Number of
Restricted
Stock and Units
Weighted Average
Grant Date Value
Per Share
(In Millions)
Outstanding at December 31, 2011 ......................... 6.9 $29.54
Granted ............................................. 1.4 54.96
Lapse of restrictions ................................... (4.3) 18.82
Forfeited or Canceled .................................. (0.3) 49.06
Outstanding at December 31, 2012 ......................... 3.7 $50.49
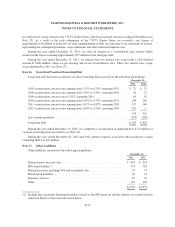
2002 Employee Stock Purchase Plan
In April 2002, the Board of Directors adopted (and in May 2002 the shareholders approved) our 2002
Employee Stock Purchase Plan (the “ESPP”) to provide our employees with an opportunity to purchase shares
through payroll deductions and we reserved approximately 12.0 million shares for issuance under the ESPP. The
ESPP commenced in October 2002.
All full-time employees who have completed 30 days of continuous service and who are employed by us on
U.S. payrolls are eligible to participate in the ESPP. Eligible employees may contribute up to 20% of their total
cash compensation to the ESPP. Amounts withheld are applied at the end of every three-month accumulation
period to purchase shares. The value of the shares (determined as of the beginning of the offering period) that
may be purchased by any participant in a calendar year is limited to $25,000. The purchase price to employees is
equal to 95% of the fair market value of shares at the end of each period. Participants may withdraw their
contributions at any time before shares are purchased.
F-39