Starwood 2012 Annual Report Download - page 103
Download and view the complete annual report
Please find page 103 of the 2012 Starwood annual report below. You can navigate through the pages in the report by either clicking on the pages listed below, or by using the keyword search tool below to find specific information within the annual report.-
 1
1 -
2
-
3
-
4
-
5
-
6
-
7
-
8
-
9
-
10
-
11
-
12
-
13
-
14
-
15
-
16
-
17
-
18
-
19
-
20
-
21
-
22
-
23
-
24
-
25
-
26
-
27
-
28
-
29
-
30
-
31
-
32
-
33
-
34
-
35
-
36
-
37
-
38
-
39
-
40
-
41
-
42
-
43
-
44
-
45
-
46
-
47
-
48
-
49
-
50
-
51
-
52
-
53
-
54
-
55
-
56
-
57
-
58
-
59
-
60
-
61
-
62
-
63
-
64
-
65
-
66
-
67
-
68
-
69
-
70
-
71
-
72
-
73
-
74
-
75
-
76
-
77
-
78
-
79
-
80
-
81
-
82
-
83
-
84
-
85
-
86
-
87
-
88
-
89
-
90
-
91
-
92
-
 93
93 -
 94
94 -
 95
95 -
 96
96 -
 97
97 -
 98
98 -
 99
99 -
 100
100 -
 101
101 -
 102
102 -
 103
103 -
 104
104 -
 105
105 -
 106
106 -
 107
107 -
 108
108 -
 109
109 -
 110
110 -
 111
111 -
 112
112 -
 113
113 -
114
-
115
-
116
-
117
-
118
-
119
-
120
-
121
-
122
-
123
-
124
-
125
-
126
-
127
-
128
-
129
-
130
-
131
-
132
-
133
-
134
-
135
-
136
-
137
-
138
-
139
-
140
-
141
-
142
-
143
-
144
-
145
-
146
-
147
-
148
-
149
-
150
-
151
-
152
-
153
-
154
-
155
-
156
-
157
-
158
-
159
-
160
-
161
-
162
-
163
-
164
-
165
-
166
-
167
-
168
-
169
-
170
-
171
-
172
-
173
-
174
-
175
-
176
-
177
-
178
-
179
-
180
-
181
-
182
-
183
-
184
-
185
-
186
-
187
-
188
-
189
-
190
-
191
-
192
-
193
-
194
-
195
-
196
-
197
-
198
-
199
-
200
-
201
-
202
-
203
-
204
-
205
-
206
-
207
-
208
-
209
-
210
 |
 |

with approximately 1,800 rooms exited our system. In addition, during 2012 we signed franchise agreements for
52 hotels with approximately 8,900 rooms, a portion of which opened in 2012 and a portion of which will open
in the future.
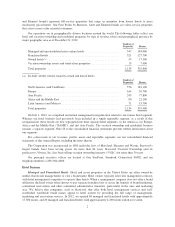
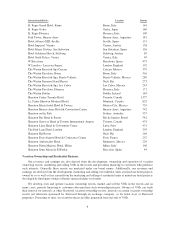
Owned, Leased and Consolidated Joint Venture Hotels. Historically, we have derived the majority of our
revenues and operating income from our owned, leased and consolidated joint venture hotels and a significant
portion of these results are driven by the hotels in North America. However, beginning in 2006, we embarked
upon a strategy of selling a significant number of hotels. The majority of these hotels were sold subject to long-
term management or franchise contracts. Total revenues generated from our owned, leased and consolidated joint
venture hotels worldwide for the years ending December 31, 2012, 2011 and 2010 were $1.698 billion,
$1.768 billion and $1.704 billion, respectively (total revenues from our owned, leased and consolidated joint
venture hotels in North America were $956 million, $1.001 billion and $1.067 billion for 2012, 2011 and 2010,
respectively).
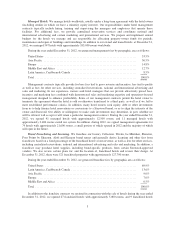
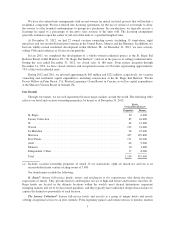
The following represents our top five markets in the United States by metropolitan area as a percentage of
our total owned, leased and consolidated joint venture revenues for the years ended December 31, 2012 and
2011:
Top Five Domestic Markets in the United States as a % of Total Owned
Revenues for the Years Ended December 31, 2012 and 2011(1)
2012 2011
Metropolitan Area Revenues Revenues
New York, NY ................................................... 11.9% 12.4%
Hawaii .......................................................... 6.7% 6.1%
Phoenix, AZ ...................................................... 5.6% 5.3%
San Francisco, CA ................................................. 4.6% 4.1%
Atlanta, GA ...................................................... 3.1% 3.6%
(1) Includes the revenues of hotels sold for the period prior to their sale.
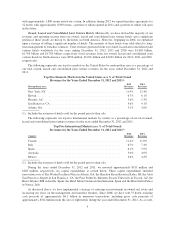
The following represents our top five international markets by country as a percentage of our total owned,
leased and consolidated joint venture revenues for the years ended December 31, 2012 and 2011:
Top Five International Markets as a % of Total Owned
Revenues for the Years Ended December 31, 2012 and 2011(1)
2012 2011
Country Revenues Revenues
Canada .......................................................... 11.4% 11.0%
Italy ............................................................ 6.7% 7.4%
Spain ........................................................... 6.1% 5.9%
Australia ........................................................ 5.0% 4.9%
Mexico .......................................................... 4.6% 4.2%
(1) Includes the revenues of hotels sold for the period prior to their sale.
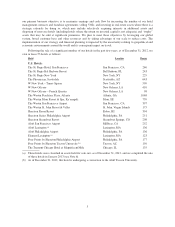
During the years ended December 31, 2012 and 2011, we invested approximately $315 million and
$283 million, respectively, for capital expenditures at owned hotels. These capital expenditures included
renovation costs at The Westin Peachtree Plaza in Atlanta, GA, the Sheraton Kauai Resort in Koloa, HI, the Aloft
San Francisco Airport in San Francisco, CA, the Four Points by Sheraton Tucson University in Tucson, AZ, the
Hotel Alfonso XIII in Seville, Spain, the Hotel Maria Cristina in San Sebastian, Spain and the Hotel Gritti Palace
in Venice, Italy.
As discussed above, we have implemented a strategy of reducing our investment in owned real estate and
increasing our focus on the management and franchise business. Since 2006, we have sold 73 hotels realizing
cash proceeds of approximately $6.1 billion in numerous transactions, including gross cash proceeds of
approximately $542 million from the sale of eight hotels during the year ended December 31, 2012. As a result,
4