Starwood 2012 Annual Report Download - page 192
Download and view the complete annual report
Please find page 192 of the 2012 Starwood annual report below. You can navigate through the pages in the report by either clicking on the pages listed below, or by using the keyword search tool below to find specific information within the annual report.-
 1
1 -
2
-
3
-
4
-
5
-
6
-
7
-
8
-
9
-
10
-
11
-
12
-
13
-
14
-
15
-
16
-
17
-
18
-
19
-
20
-
21
-
22
-
23
-
24
-
25
-
26
-
27
-
28
-
29
-
30
-
31
-
32
-
33
-
34
-
35
-
36
-
37
-
38
-
39
-
40
-
41
-
42
-
43
-
44
-
45
-
46
-
47
-
48
-
49
-
50
-
51
-
52
-
53
-
54
-
55
-
56
-
57
-
58
-
59
-
60
-
61
-
62
-
63
-
64
-
65
-
66
-
67
-
68
-
69
-
70
-
71
-
72
-
73
-
74
-
75
-
76
-
77
-
78
-
79
-
80
-
81
-
82
-
83
-
84
-
85
-
86
-
87
-
88
-
89
-
90
-
91
-
92
-
93
-
94
-
95
-
96
-
97
-
98
-
99
-
100
-
101
-
102
-
103
-
104
-
105
-
106
-
107
-
108
-
109
-
110
-
111
-
112
-
113
-
114
-
115
-
116
-
117
-
118
-
119
-
120
-
121
-
122
-
123
-
124
-
125
-
126
-
127
-
128
-
129
-
130
-
131
-
132
-
133
-
134
-
135
-
136
-
137
-
138
-
139
-
140
-
141
-
142
-
143
-
144
-
145
-
146
-
147
-
148
-
149
-
150
-
151
-
152
-
153
-
154
-
155
-
156
-
157
-
158
-
159
-
160
-
161
-
162
-
163
-
164
-
165
-
166
-
167
-
168
-
169
-
170
-
171
-
172
-
173
-
174
-
175
-
176
-
177
-
178
-
179
-
180
-
181
-
 182
182 -
 183
183 -
 184
184 -
 185
185 -
 186
186 -
 187
187 -
 188
188 -
 189
189 -
 190
190 -
 191
191 -
 192
192 -
 193
193 -
 194
194 -
 195
195 -
 196
196 -
 197
197 -
 198
198 -
 199
199 -
 200
200 -
 201
201 -
 202
202 -
203
-
204
-
205
-
206
-
207
-
208
-
209
-
210
 |
 |

STARWOOD HOTELS & RESORTS WORLDWIDE, INC.
NOTES TO FINANCIAL STATEMENTS
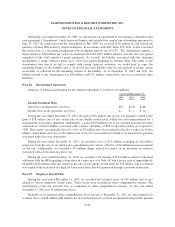
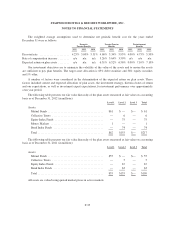
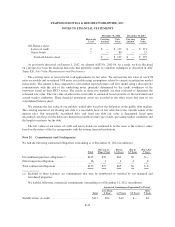
The weighted average assumptions used to determine net periodic benefit cost for the years ended
December 31 were as follows:
Domestic
Pension Benefits
Foreign Pension
Benefits
Postretirement
Benefits
2012 2011 2010 2012 2011 2010 2012 2011 2010
Discount rate ..................... 4.25% 5.00% 5.51% 4.68% 5.34% 5.93% 4.00% 4.75% 5.50%
Rate of compensation increase ........ n/a n/a n/a 3.26% 3.64% 3.50% n/a n/a n/a
Expected return on plan assets ........ n/a n/a n/a 6.31% 6.52% 6.56% 0.00% 7.10% 7.10%
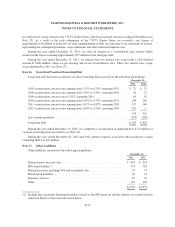
Our investment objectives are to minimize the volatility of the value of the assets and to ensure the assets
are sufficient to pay plan benefits. The target asset allocation is 63% debt securities and 36% equity securities
and 1% other.
A number of factors were considered in the determination of the expected return on plan assets. These
factors included current and expected allocation of plan assets, the investment strategy, historical rates of return
and our expectations, as well as investment expert expectations, for investment performance over approximately
a ten year period.
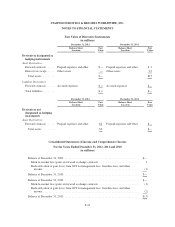
The following table presents our fair value hierarchy of the plan assets measured at fair value on a recurring
basis as of December 31, 2012 (in millions):
Level 1 Level 2 Level 3 Total
Assets:
Mutual Funds ....................................... $61 $ — $— $ 61
Collective Trusts .................................... — 6 — 6
Equity Index Funds .................................. — 75 — 75
Money Markets ..................................... 1 — — 1
Bond Index Funds ................................... — 74 — 74
Total .............................................. $62 $155 $— $217
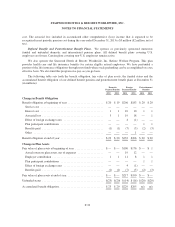
The following table presents our fair value hierarchy of the plan assets measured at fair value on a recurring
basis as of December 31, 2011 (in millions):
Level 1 Level 2 Level 3 Total
Assets:
Mutual Funds ....................................... $55 $ — $— $ 55
Collective Trusts .................................... — 5 — 5
Equity Index Funds .................................. — 67 — 67
Bond Index Funds ................................... — 63 — 63
Total .............................................. $55 $135 $— $190
All assets are valued using quoted market prices in active markets.
F-35