Starwood 2012 Annual Report Download - page 128
Download and view the complete annual report
Please find page 128 of the 2012 Starwood annual report below. You can navigate through the pages in the report by either clicking on the pages listed below, or by using the keyword search tool below to find specific information within the annual report.-
 1
1 -
2
-
3
-
4
-
5
-
6
-
7
-
8
-
9
-
10
-
11
-
12
-
13
-
14
-
15
-
16
-
17
-
18
-
19
-
20
-
21
-
22
-
23
-
24
-
25
-
26
-
27
-
28
-
29
-
30
-
31
-
32
-
33
-
34
-
35
-
36
-
37
-
38
-
39
-
40
-
41
-
42
-
43
-
44
-
45
-
46
-
47
-
48
-
49
-
50
-
51
-
52
-
53
-
54
-
55
-
56
-
57
-
58
-
59
-
60
-
61
-
62
-
63
-
64
-
65
-
66
-
67
-
68
-
69
-
70
-
71
-
72
-
73
-
74
-
75
-
76
-
77
-
78
-
79
-
80
-
81
-
82
-
83
-
84
-
85
-
86
-
87
-
88
-
89
-
90
-
91
-
92
-
93
-
94
-
95
-
96
-
97
-
98
-
99
-
100
-
101
-
102
-
103
-
104
-
105
-
106
-
107
-
108
-
109
-
110
-
111
-
112
-
113
-
114
-
115
-
116
-
117
-
 118
118 -
 119
119 -
 120
120 -
 121
121 -
 122
122 -
 123
123 -
 124
124 -
 125
125 -
 126
126 -
 127
127 -
 128
128 -
 129
129 -
 130
130 -
 131
131 -
 132
132 -
 133
133 -
 134
134 -
 135
135 -
 136
136 -
 137
137 -
 138
138 -
139
-
140
-
141
-
142
-
143
-
144
-
145
-
146
-
147
-
148
-
149
-
150
-
151
-
152
-
153
-
154
-
155
-
156
-
157
-
158
-
159
-
160
-
161
-
162
-
163
-
164
-
165
-
166
-
167
-
168
-
169
-
170
-
171
-
172
-
173
-
174
-
175
-
176
-
177
-
178
-
179
-
180
-
181
-
182
-
183
-
184
-
185
-
186
-
187
-
188
-
189
-
190
-
191
-
192
-
193
-
194
-
195
-
196
-
197
-
198
-
199
-
200
-
201
-
202
-
203
-
204
-
205
-
206
-
207
-
208
-
209
-
210
 |
 |

We may continue to reposition our owned, leased and consolidated joint venture hotels as we pursue our brand
and quality strategies. In addition, several owned hotels are located in regions which are seasonal and, therefore,
these hotels do not operate at full capacity throughout the year.
We and our hotel owners have continued to invest capital in our hotels and provide innovative ways to
utilize public space, such as our Link@SheratonSM experienced with Microsoft, and also by maximizing guest
room conveniences. Finally, we believe our SPG loyalty guest program is an industry leader. With our recently
announced changes to the program, we expect to drive further loyalty to our properties and brands from our SPG
members as well as attract the next wave of global elite members. As the program is constantly refined and new
promotions are offered, it provides rewards to our patrons while its growth in membership favorably impacts our
results. As we move forward to 2013, we will continue to focus on providing superior guest experiences for our
business, leisure, and group customers while maintaining a commitment to controlling our costs.
On July 1, 2012, we completed an internal management reorganization related to how we manage and
operate our former hotel operating segment. Whereas our hotel business had previously been included in a single
reportable segment, as a result of this reorganization, these results are now segregated into three separate hotel
segments: (i) the Americas, (ii) EAME, and (iii) Asia Pacific. Our vacation ownership and residential business
remains a separate segment. Prior period data has been restated to be consistent with the current year
presentation.
In addition to revenues recorded within our four segments, we also have other revenues from managed and
franchised properties, which represent the reimbursement of costs incurred on behalf of managed property
owners. These revenues, together with the corresponding expenses, are not recorded within our segments. Other
corporate unallocated revenues and earnings primarily relate to other license fee income and are also reported
outside of segment revenues.
This Management’s Discussion and Analysis of Financial Condition and Results of Operations includes
discussion of our consolidated operating results, which were unaffected by our internal management
reorganization, as well as discussion about each of our four segments. Additionally, Note 26 to the consolidated
financial statements presents further information about our segments.
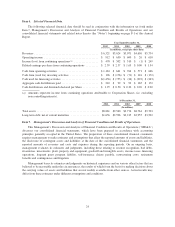
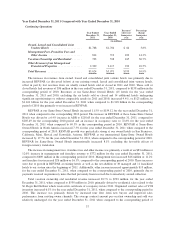
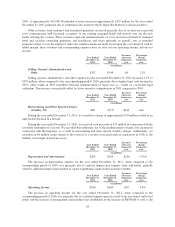
Year Ended December 31, 2012 Compared with Year Ended December 31, 2011
Consolidated Results
Year Ended
December 31,
2012
Year Ended
December 31,
2011
Increase /
(decrease)
from prior
year
Percentage
change
from prior
year
(in millions)
Owned, Leased and Consolidated Joint Venture Hotels .... $1,698 $1,768 $ (70) (4.0)%
Management Fees, Franchise Fees and Other Income .... 888 814 74 9.1%
Vacation Ownership and Residential ................... 1,287 703 584 83.1%
Other Revenues from Managed and Franchised
Properties ....................................... 2,448 2,339 109 4.7%
Total Revenues .................................... $6,321 $5,624 $697 12.4%
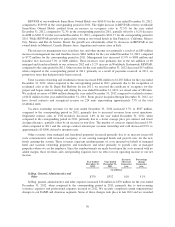
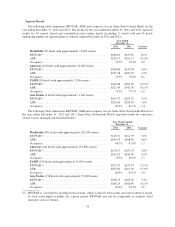
The decrease in revenues from owned, leased and consolidated joint venture hotels was primarily due to lost
revenues from 11 owned hotels that were sold or closed in 2011 and 2012. These sold or closed hotels had
revenues of $420 million in the year ended December 31, 2012, compared to $484 million for the corresponding
period in 2011. Revenues at our Same-Store Owned Hotels (39 hotels for the year ended December 31, 2012 and
2011, excluding the 11 hotels sold and 14 additional hotels undergoing significant repositionings or without
comparable results in 2012 and 2011) decreased 0.2%, or $3 million, to $1.252 billion for the year ended
December 31, 2012, when compared to $1.255 billion in the corresponding period of 2011.
29