Starwood 2012 Annual Report Download - page 177
Download and view the complete annual report
Please find page 177 of the 2012 Starwood annual report below. You can navigate through the pages in the report by either clicking on the pages listed below, or by using the keyword search tool below to find specific information within the annual report.-
 1
1 -
2
-
3
-
4
-
5
-
6
-
7
-
8
-
9
-
10
-
11
-
12
-
13
-
14
-
15
-
16
-
17
-
18
-
19
-
20
-
21
-
22
-
23
-
24
-
25
-
26
-
27
-
28
-
29
-
30
-
31
-
32
-
33
-
34
-
35
-
36
-
37
-
38
-
39
-
40
-
41
-
42
-
43
-
44
-
45
-
46
-
47
-
48
-
49
-
50
-
51
-
52
-
53
-
54
-
55
-
56
-
57
-
58
-
59
-
60
-
61
-
62
-
63
-
64
-
65
-
66
-
67
-
68
-
69
-
70
-
71
-
72
-
73
-
74
-
75
-
76
-
77
-
78
-
79
-
80
-
81
-
82
-
83
-
84
-
85
-
86
-
87
-
88
-
89
-
90
-
91
-
92
-
93
-
94
-
95
-
96
-
97
-
98
-
99
-
100
-
101
-
102
-
103
-
104
-
105
-
106
-
107
-
108
-
109
-
110
-
111
-
112
-
113
-
114
-
115
-
116
-
117
-
118
-
119
-
120
-
121
-
122
-
123
-
124
-
125
-
126
-
127
-
128
-
129
-
130
-
131
-
132
-
133
-
134
-
135
-
136
-
137
-
138
-
139
-
140
-
141
-
142
-
143
-
144
-
145
-
146
-
147
-
148
-
149
-
150
-
151
-
152
-
153
-
154
-
155
-
156
-
157
-
158
-
159
-
160
-
161
-
162
-
163
-
164
-
165
-
166
-
 167
167 -
 168
168 -
 169
169 -
 170
170 -
 171
171 -
 172
172 -
 173
173 -
 174
174 -
 175
175 -
 176
176 -
 177
177 -
 178
178 -
 179
179 -
 180
180 -
 181
181 -
 182
182 -
 183
183 -
 184
184 -
 185
185 -
 186
186 -
 187
187 -
188
-
189
-
190
-
191
-
192
-
193
-
194
-
195
-
196
-
197
-
198
-
199
-
200
-
201
-
202
-
203
-
204
-
205
-
206
-
207
-
208
-
209
-
210
 |
 |

STARWOOD HOTELS & RESORTS WORLDWIDE, INC.
NOTES TO FINANCIAL STATEMENTS
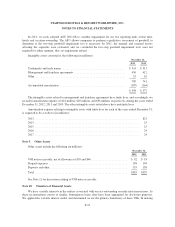
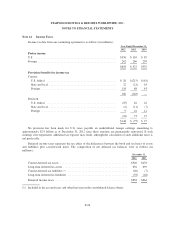
The above balances include unamortized capitalized computer software costs of $108 million and $155
million at December 31, 2012 and 2011 respectively. Amortization of capitalized computer software costs was
$33 million, $32 million and $36 million for the years ended December 31, 2012, 2011 and 2010, respectively.
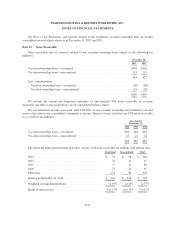
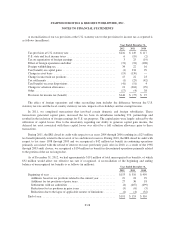
Note 8. Goodwill and Intangible Assets
The changes in the carrying amount of goodwill for the years ended December 31, 2012 and 2011 is as
follows (in millions):
Americas
Segment
EAME
Segment
Asia
Pacific
Segment
Vacation
Ownership
and
Residential
Segment Total
Balance at January 1, 2011 ............... $819 $242 $283 $151 $1,495
Acquisitions .......................... — 26 — — 26
Currency translation adjustment ........... — (11) — — (11)
Asset dispositions ...................... (33) — — — (33)
Other ................................ — (1) — — (1)
Balance at December 31, 2011 ............ $786 $256 $283 $151 $1,476
Balance at January 1, 2012 ............... $786 $256 $283 $151 $1,476
Acquisitions .......................... — 6 — — 6
Currency translation adjustment ........... — 3 — — 3
Asset dispositions ...................... (58) — — — (58)
Other ................................ — — — — —
Balance at December 31, 2012 ............ $728 $265 $283 $151 $1,427
In 2012, we changed our reportable segments and have reclassified the above table to be consistent with our
new reportable segments (see Note 26).
As previously discussed in Note 6, Assets Held for Sale, we included approximately $4 million of goodwill
in assets held for sale, which represented the goodwill we allocated to the sale of wholly-owned hotels that took
place in January 2013. The goodwill balances as of December 31, 2011 have been reclassified to be consistent
with the current year presentation.
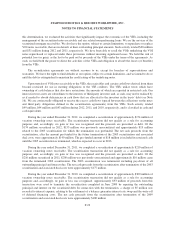
At October 31, 2012, the date of our annual impairment valuation, the vacation ownership and residential
segment’s fair value significantly exceeded its book value. The fair value was determined primarily from a
discounted cash flow model, in which the underlying cash flows were derived from our current financial
projections. The two key assumptions used in the fair value calculation are the discount rate and the
capitalization rate in the terminal period, which were 10% and 2%, respectively. Based on the results of the
discounted cash flow model and the comparison of the segment’s fair value to its book value, we determined
goodwill was not impaired.
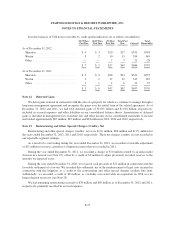
At October 31, 2012, the date of our annual impairment valuation, we evaluated the goodwill for the hotel
segments and determined that, for each of the hotel segments, the fair value significantly exceeded the book
value. We used a market approach to determine the fair value of the reporting units. We utilized earnings
multiples from various independent, third party investment firms and applied those earnings multiples to the
respective earnings streams (owned hotels, management and franchise fees and other) generated by each of our
hotel segments to determine the fair value for each of the hotel segments.
F-20