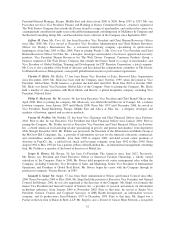
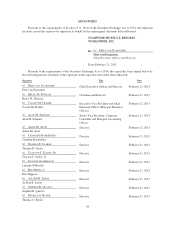
Starwood 2012 Annual Report Download - page 149
Download and view the complete annual report
Please find page 149 of the 2012 Starwood annual report below. You can navigate through the pages in the report by either clicking on the pages listed below, or by using the keyword search tool below to find specific information within the annual report.-
 1
1 -
2
-
3
-
4
-
5
-
6
-
7
-
8
-
9
-
10
-
11
-
12
-
13
-
14
-
15
-
16
-
17
-
18
-
19
-
20
-
21
-
22
-
23
-
24
-
25
-
26
-
27
-
28
-
29
-
30
-
31
-
32
-
33
-
34
-
35
-
36
-
37
-
38
-
39
-
40
-
41
-
42
-
43
-
44
-
45
-
46
-
47
-
48
-
49
-
50
-
51
-
52
-
53
-
54
-
55
-
56
-
57
-
58
-
59
-
60
-
61
-
62
-
63
-
64
-
65
-
66
-
67
-
68
-
69
-
70
-
71
-
72
-
73
-
74
-
75
-
76
-
77
-
78
-
79
-
80
-
81
-
82
-
83
-
84
-
85
-
86
-
87
-
88
-
89
-
90
-
91
-
92
-
93
-
94
-
95
-
96
-
97
-
98
-
99
-
100
-
101
-
102
-
103
-
104
-
105
-
106
-
107
-
108
-
109
-
110
-
111
-
112
-
113
-
114
-
115
-
116
-
117
-
118
-
119
-
120
-
121
-
122
-
123
-
124
-
125
-
126
-
127
-
128
-
129
-
130
-
131
-
132
-
133
-
134
-
135
-
136
-
137
-
138
-
 139
139 -
 140
140 -
 141
141 -
 142
142 -
 143
143 -
 144
144 -
 145
145 -
 146
146 -
 147
147 -
 148
148 -
 149
149 -
 150
150 -
 151
151 -
 152
152 -
 153
153 -
 154
154 -
 155
155 -
 156
156 -
 157
157 -
 158
158 -
 159
159 -
160
-
161
-
162
-
163
-
164
-
165
-
166
-
167
-
168
-
169
-
170
-
171
-
172
-
173
-
174
-
175
-
176
-
177
-
178
-
179
-
180
-
181
-
182
-
183
-
184
-
185
-
186
-
187
-
188
-
189
-
190
-
191
-
192
-
193
-
194
-
195
-
196
-
197
-
198
-
199
-
200
-
201
-
202
-
203
-
204
-
205
-
206
-
207
-
208
-
209
-
210
 |
 |

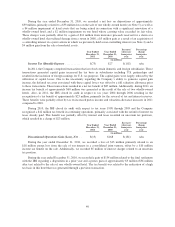
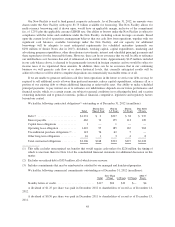
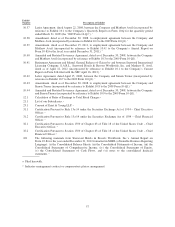
The following table sets forth the scheduled maturities and the total fair value of our indebtedness and
financial instruments as of December 31, 2012 (in millions, excluding average exchange rates):
Expected Maturity or Transaction Date
At December 31, Total at
December 31,
2012
Total Fair
Value at
December 31,
20122013 2014 2015 2016 2017 Thereafter
Indebtedness
Fixed rate ...................... $ 1 $— $294 $— $— $937 $1,232 $1,406
Average interest rate .............. 5.90%
Floating rate .................... $ 1 $ 2 $ 2 $35 $ 3 $ — $ 43 $ 43
Average interest rate .............. 4.65%
Forward Foreign Exchange Hedge
Contracts:
Fixed (EUR) to Fixed (USD) ....... $ 40 $— $ — $— $— $ — $ (1) $ (1)
Average Exchange rate ............ 1.29
Forward Foreign Exchange
Contracts:
Fixed (EUR) to Fixed (USD) ....... $ 55 $— $ — $— $— $ — $ — $ —
Average Exchange rate ............ 1.31
Fixed (USD) to Fixed (EUR) ....... $ 41 $— $ — $— $— $ — $ — $ —
Average Exchange rate ............ 0.76
Fixed (CLP) to Fixed (USD) ....... $ 59 $— $ — $— $— $ — $ — $ —
Average Exchange rate ............ 0.00
Fixed (THB) to Fixed (USD) ....... $ 13 $— $ — $— $— $ — $ — $ —
Average Exchange rate ............ 0.03
Fixed (JPY) to Fixed (USD) ........ $ 84 $— $ — $— $— $ — $ 2 $ 2
Average Exchange rate ............ 0.01
Fixed (MXP) to Fixed (USD) ....... $ 10 $— $ — $— $— $ — $ — $ —
Average Exchange rate ............ 0.08
Fixed (AUD) to Fixed (USD) ....... $ 15 $— $ — $— $— $ — $ — $ —
Average Exchange rate ............ 0.96
Fixed (CAD) to Fixed (USD) ....... $259 $— $ — $— $— $ — $ — $ —
Average Exchange rate ............ 1.01
Fixed (GBP) to Fixed (EUR) ....... $ 90 $— $ — $— $— $ — $ — $ —
Fixed (JPY) to Fixed (THB) ........ $ 19 $— $ — $— $— $ — $ — $ —
Item 8. Financial Statements and Supplementary Data.
The financial statements and supplementary data required by this item appear beginning on page F-1 of this
Annual Report and are incorporated herein by reference.
Item 9. Changes in and Disagreements with Accountants on Accounting and Financial Disclosure.
Not applicable.
Item 9A. Controls and Procedures.
As of the end of the period covered by this report, we carried out an evaluation, under the supervision and
with the participation of our management, including our principal executive and principal financial officers, of
the effectiveness of the design and operation of our disclosure controls and procedures (as such term is defined in
50