Starwood 2012 Annual Report Download - page 13
Download and view the complete annual report
Please find page 13 of the 2012 Starwood annual report below. You can navigate through the pages in the report by either clicking on the pages listed below, or by using the keyword search tool below to find specific information within the annual report.-
 1
1 -
2
-
 3
3 -
 4
4 -
 5
5 -
 6
6 -
 7
7 -
 8
8 -
 9
9 -
 10
10 -
 11
11 -
 12
12 -
 13
13 -
 14
14 -
 15
15 -
 16
16 -
 17
17 -
 18
18 -
 19
19 -
 20
20 -
 21
21 -
 22
22 -
 23
23 -
24
-
25
-
26
-
27
-
28
-
29
-
30
-
31
-
32
-
33
-
34
-
35
-
36
-
37
-
38
-
39
-
40
-
41
-
42
-
43
-
44
-
45
-
46
-
47
-
48
-
49
-
50
-
51
-
52
-
53
-
54
-
55
-
56
-
57
-
58
-
59
-
60
-
61
-
62
-
63
-
64
-
65
-
66
-
67
-
68
-
69
-
70
-
71
-
72
-
73
-
74
-
75
-
76
-
77
-
78
-
79
-
80
-
81
-
82
-
83
-
84
-
85
-
86
-
87
-
88
-
89
-
90
-
91
-
92
-
93
-
94
-
95
-
96
-
97
-
98
-
99
-
100
-
101
-
102
-
103
-
104
-
105
-
106
-
107
-
108
-
109
-
110
-
111
-
112
-
113
-
114
-
115
-
116
-
117
-
118
-
119
-
120
-
121
-
122
-
123
-
124
-
125
-
126
-
127
-
128
-
129
-
130
-
131
-
132
-
133
-
134
-
135
-
136
-
137
-
138
-
139
-
140
-
141
-
142
-
143
-
144
-
145
-
146
-
147
-
148
-
149
-
150
-
151
-
152
-
153
-
154
-
155
-
156
-
157
-
158
-
159
-
160
-
161
-
162
-
163
-
164
-
165
-
166
-
167
-
168
-
169
-
170
-
171
-
172
-
173
-
174
-
175
-
176
-
177
-
178
-
179
-
180
-
181
-
182
-
183
-
184
-
185
-
186
-
187
-
188
-
189
-
190
-
191
-
192
-
193
-
194
-
195
-
196
-
197
-
198
-
199
-
200
-
201
-
202
-
203
-
204
-
205
-
206
-
207
-
208
-
209
-
210
 |
 |

STARWOOD HOTELS & RESORTS WORLDWIDE, INC.-2013Proxy Statement 7
PROXY SUMMARY
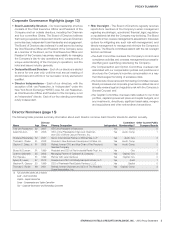
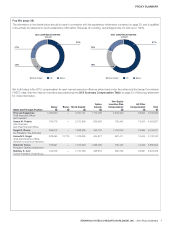
Pay Mix (page 38 )
The information in the charts below should be read in connection with the explanatory information contained on page 38 , and is qualifi ed
in its entirety by reference to such explanatory information. Because of rounding, percentages may not add up to 100%.
59%
14%
27%
CEO COMPENSATION MIX
LTIBase Salary Bonus
TARGET
61%
19%
19%
NEO COMPENSATION MIX
LTIBase Salary Bonus
TARGET
Set forth below is the 2012 compensation for each named executive offi cer as determined under Securities and Exchange Commission
(“SEC”) rules. See the notes and narrative accompanying the 2012 Summary Compensation Table on page 55 of this proxy statement
for more information.
Name and Principal Position Salary
($) Bonus
($) Stock Awards
($)
Option
Awards
($)
Non-Equity
IncentivePlan
Compensation
($)
All Other
Compensation
($) Total
($)
Frits van Paasschen
Chief Executive Offi cer
andPresident
1,250,000 — 4,327,101 1,172,036 2,300,000 53,902 9,103,039
Vasant M. Prabhu
Vice Chairman
andChiefFinancial Offi cer
764,279 — 2,310,809 639,296 705,443 10,000 4,429,827
Sergio D. Rivera
Co-President, The Americas
699,912 — 1,258,469 255,726 1,764,240 26,894 4,005,241
Kenneth S. Siegel
Chief Administrative Offi cer,
General Counsel and Secretary
638,490 12,770 1,476,605 404,877 587,411 10,000 3,130,153
Simon M. Turner
President, Global Development
763,991 — 1,310,690 1,065,480 705,443 10,000 3,855,604
Matthew E. Avril
Former President, Hotel Group
764,279 — 1,710,765 468,818 352,722 26,891 3,323,475