Starwood 2012 Annual Report Download - page 204
Download and view the complete annual report
Please find page 204 of the 2012 Starwood annual report below. You can navigate through the pages in the report by either clicking on the pages listed below, or by using the keyword search tool below to find specific information within the annual report.-
 1
1 -
2
-
3
-
4
-
5
-
6
-
7
-
8
-
9
-
10
-
11
-
12
-
13
-
14
-
15
-
16
-
17
-
18
-
19
-
20
-
21
-
22
-
23
-
24
-
25
-
26
-
27
-
28
-
29
-
30
-
31
-
32
-
33
-
34
-
35
-
36
-
37
-
38
-
39
-
40
-
41
-
42
-
43
-
44
-
45
-
46
-
47
-
48
-
49
-
50
-
51
-
52
-
53
-
54
-
55
-
56
-
57
-
58
-
59
-
60
-
61
-
62
-
63
-
64
-
65
-
66
-
67
-
68
-
69
-
70
-
71
-
72
-
73
-
74
-
75
-
76
-
77
-
78
-
79
-
80
-
81
-
82
-
83
-
84
-
85
-
86
-
87
-
88
-
89
-
90
-
91
-
92
-
93
-
94
-
95
-
96
-
97
-
98
-
99
-
100
-
101
-
102
-
103
-
104
-
105
-
106
-
107
-
108
-
109
-
110
-
111
-
112
-
113
-
114
-
115
-
116
-
117
-
118
-
119
-
120
-
121
-
122
-
123
-
124
-
125
-
126
-
127
-
128
-
129
-
130
-
131
-
132
-
133
-
134
-
135
-
136
-
137
-
138
-
139
-
140
-
141
-
142
-
143
-
144
-
145
-
146
-
147
-
148
-
149
-
150
-
151
-
152
-
153
-
154
-
155
-
156
-
157
-
158
-
159
-
160
-
161
-
162
-
163
-
164
-
165
-
166
-
167
-
168
-
169
-
170
-
171
-
172
-
173
-
174
-
175
-
176
-
177
-
178
-
179
-
180
-
181
-
182
-
183
-
184
-
185
-
186
-
187
-
188
-
189
-
190
-
191
-
192
-
193
-
 194
194 -
 195
195 -
 196
196 -
 197
197 -
 198
198 -
 199
199 -
 200
200 -
 201
201 -
 202
202 -
 203
203 -
 204
204 -
 205
205 -
 206
206 -
 207
207 -
 208
208 -
 209
209 -
 210
210
 |
 |

STARWOOD HOTELS & RESORTS WORLDWIDE, INC.
NOTES TO FINANCIAL STATEMENTS
The CODM primarily evaluates the operating performance of a segment based on segment earnings. We
define segment earnings as net income attributable to our common stockholders before interest expense, taxes,
depreciation and amortization, as well as our share of interest, depreciation and amortization associated with our
unconsolidated joint ventures. Segment earnings also excludes certain recurring and nonrecurring items, such as
restructuring costs, goodwill impairment and other special charges, gains and (losses) on debt extinguishment
and gains (losses) on asset dispositions and impairments. General, administrative and other expenses directly
related to the segments are included in the calculation of segment earnings, whereas corporate general,
administrative, and other expenses are not included in the segment earnings calculation. In addition to revenues
recorded within our four segments, we also have other revenues from managed and franchised properties, which
primarily represent the reimbursement of costs incurred on behalf of managed property owners. These revenues,
together with the corresponding expenses, are not recorded within the segments. Other corporate unallocated
revenues and earnings primarily relate to other license fee income and are also reported outside of segment
revenues.
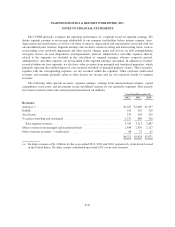
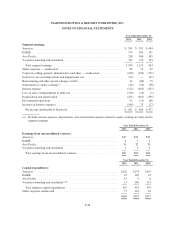
The following tables present revenues, segment earnings, earnings from unconsolidated ventures, capital
expenditures, total assets, and investments in unconsolidated ventures for our reportable segments. Prior periods
have been restated to reflect the current period presentation (in millions):
Year Ended December 31,
2012 2011 2010
Revenues:
Americas (a) ........................................................... $1,627 $1,630 $1,597
EAME ............................................................... 550 592 529
Asia Pacific .......................................................... 337 303 235
Vacation ownership and residential ........................................ 1,271 688 526
Total segment revenues ............................................... 3,785 3,213 2,887
Other revenues from managed and franchised hotels .......................... 2,448 2,339 2,117
Other corporate revenues — unallocated .................................... 88 72 67
$6,321 $5,624 $5,071
(a) Includes revenues of $1.1 billion for the years ended 2012, 2011 and 2010, respectively, from hotels located
in the United States. No other country contributed more than 10% of our total revenues.
F-47