Starwood 2012 Annual Report Download - page 49
Download and view the complete annual report
Please find page 49 of the 2012 Starwood annual report below. You can navigate through the pages in the report by either clicking on the pages listed below, or by using the keyword search tool below to find specific information within the annual report.-
 1
1 -
2
-
3
-
4
-
5
-
6
-
7
-
8
-
9
-
10
-
11
-
12
-
13
-
14
-
15
-
16
-
17
-
18
-
19
-
20
-
21
-
22
-
23
-
24
-
25
-
26
-
27
-
28
-
29
-
30
-
31
-
32
-
33
-
34
-
35
-
36
-
37
-
38
-
 39
39 -
 40
40 -
 41
41 -
 42
42 -
 43
43 -
 44
44 -
 45
45 -
 46
46 -
 47
47 -
 48
48 -
 49
49 -
 50
50 -
 51
51 -
 52
52 -
 53
53 -
 54
54 -
 55
55 -
 56
56 -
 57
57 -
 58
58 -
 59
59 -
60
-
61
-
62
-
63
-
64
-
65
-
66
-
67
-
68
-
69
-
70
-
71
-
72
-
73
-
74
-
75
-
76
-
77
-
78
-
79
-
80
-
81
-
82
-
83
-
84
-
85
-
86
-
87
-
88
-
89
-
90
-
91
-
92
-
93
-
94
-
95
-
96
-
97
-
98
-
99
-
100
-
101
-
102
-
103
-
104
-
105
-
106
-
107
-
108
-
109
-
110
-
111
-
112
-
113
-
114
-
115
-
116
-
117
-
118
-
119
-
120
-
121
-
122
-
123
-
124
-
125
-
126
-
127
-
128
-
129
-
130
-
131
-
132
-
133
-
134
-
135
-
136
-
137
-
138
-
139
-
140
-
141
-
142
-
143
-
144
-
145
-
146
-
147
-
148
-
149
-
150
-
151
-
152
-
153
-
154
-
155
-
156
-
157
-
158
-
159
-
160
-
161
-
162
-
163
-
164
-
165
-
166
-
167
-
168
-
169
-
170
-
171
-
172
-
173
-
174
-
175
-
176
-
177
-
178
-
179
-
180
-
181
-
182
-
183
-
184
-
185
-
186
-
187
-
188
-
189
-
190
-
191
-
192
-
193
-
194
-
195
-
196
-
197
-
198
-
199
-
200
-
201
-
202
-
203
-
204
-
205
-
206
-
207
-
208
-
209
-
210
 |
 |
STARWOOD HOTELS & RESORTS WORLDWIDE, INC.-2013Proxy Statement 43
EXECUTIVE COMPENSATION
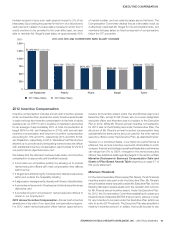
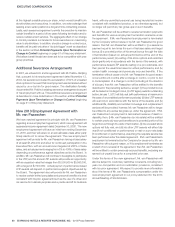
instead received a lump sum cash payment equal to 2% of his
base salary. By providing this payment in the form of a discretionary
cash payment instead of a base salary increase (in which form it
would continue to be provided to him year after year), we were
able to maintain Mr. Siegel’s base salary at approximately 65%
of market median, and not raise his salary above that level. The
Compensation Committee viewed this as a favorable result as
it effectively rewarded Mr. Siegel for his accomplishments, but
maintains his base salary (or fi xed component of compensation)
below the 75th percentile.
0
250
500
750
1,000
1,250
1,500
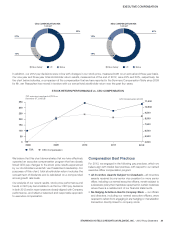
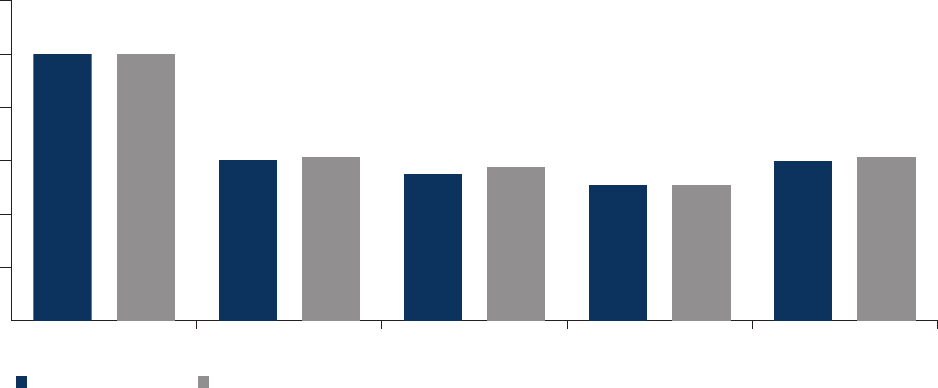
$000 2011-2012 CEO AND CURRENT NEO BASE SALARY CHANGES
$1,250,000 $1,250,000
$766,785 $722,000 $638,490
$766,785
$751,750 $674,500 $638,490
$750,020
2011 Base Salary 2012 Base Salary
van Paasschen Prabhu Rivera Siegel Turner
2012 Incentive Compensation
Incentive compensation includes annual cash incentive awards
under our Executive Plan, special non-equity incentive awards paid
in cash and long-term incentive compensation in the form of equity
awards under our LTIP. For 2012, incentive compensation accounted
for an average of approximately 80% of total compensation at
target (86% for Mr.vanPaasschen in 2012), with annual cash
incentive compensation and long-term incentive compensation
accounting for 19% and 61%, respectively (27% and 59% for Mr.
van Paasschen, respectively, in 2012). We believe that this structure
allowed us to provide each participating named executive offi cer
with substantial incentive compensation opportunities for 2012 if
our performance objectives were met.
We believe that the allocation between base salary and incentive
compensation is appropriate and benefi cial because:
•it promotes our competitive position by allowing us to provide
named executive offi cers with total compensation that refl ects
performance;
•
it targets and attracts highly motivated and talented executives
within and outside the hospitality industry;
•
it aligns senior management’s interests with those of stockholders;
•
it promotes achievement of business and individual performance
objectives;and
•
it provides long-term incentives for named executive offi cers to
remain in our employment.
2012 Annual Incentive Compensation.Annual cash incentive
awards are a key part of our executive compensation program.
For 2012, each named executive offi cer had an opportunity to
receive an incentive award under the stockholder-approved
Executive Plan, except for Mr. Rivera, who is a newly-designated
executive offi cer and therefore was not subject to the Executive
Plan in 2012. While Mr. Rivera’s annual incentive compensation
for 2012 was not te chnically paid under the Executive Plan, the
structure of Mr. Rivera’s annual incentive compensation was
substantially the same as the structure used for the other named
executive offi cers under the Executive Plan, as described below.
Viewed on a combined basis, once minimum performance is
attained, the annual incentive payments attributable to both
company fi nancial and strategic/operational/leadership performance
can range from 0% to 200% of target for the named executive
offi cers. See additional detail regarding targets in the section entitled
Narrative Disclosure to Summary Compensation Table and
Grants of Plan-Based Awards Table beginning on page 57 of
this proxy statement.
Minimum Threshold
For the named executive offi cers (except Mr. Rivera), the 2012 annual
incentive award was paid under the Executive Plan. Mr. Rivera’s
annual incentive award was paid outside the Executive Plan, but the
following discussion applies equally as to the operation and outcome
for Mr. Rivera’s annual incentive award. Under the Executive Plan,
for 2012, the Compensation Committee established in advance a
threshold level of adjusted EBITDA that we had to achieve in order
for any incentive to be paid under the Executive Plan (which we
refer to as the EP Threshold). The Executive Plan also specifi ed a
maximum incentive amount, in dollars, that could be paid to any