Starwood 2012 Annual Report Download - page 136
Download and view the complete annual report
Please find page 136 of the 2012 Starwood annual report below. You can navigate through the pages in the report by either clicking on the pages listed below, or by using the keyword search tool below to find specific information within the annual report.-
 1
1 -
2
-
3
-
4
-
5
-
6
-
7
-
8
-
9
-
10
-
11
-
12
-
13
-
14
-
15
-
16
-
17
-
18
-
19
-
20
-
21
-
22
-
23
-
24
-
25
-
26
-
27
-
28
-
29
-
30
-
31
-
32
-
33
-
34
-
35
-
36
-
37
-
38
-
39
-
40
-
41
-
42
-
43
-
44
-
45
-
46
-
47
-
48
-
49
-
50
-
51
-
52
-
53
-
54
-
55
-
56
-
57
-
58
-
59
-
60
-
61
-
62
-
63
-
64
-
65
-
66
-
67
-
68
-
69
-
70
-
71
-
72
-
73
-
74
-
75
-
76
-
77
-
78
-
79
-
80
-
81
-
82
-
83
-
84
-
85
-
86
-
87
-
88
-
89
-
90
-
91
-
92
-
93
-
94
-
95
-
96
-
97
-
98
-
99
-
100
-
101
-
102
-
103
-
104
-
105
-
106
-
107
-
108
-
109
-
110
-
111
-
112
-
113
-
114
-
115
-
116
-
117
-
118
-
119
-
120
-
121
-
122
-
123
-
124
-
125
-
 126
126 -
 127
127 -
 128
128 -
 129
129 -
 130
130 -
 131
131 -
 132
132 -
 133
133 -
 134
134 -
 135
135 -
 136
136 -
 137
137 -
 138
138 -
 139
139 -
 140
140 -
 141
141 -
 142
142 -
 143
143 -
 144
144 -
 145
145 -
 146
146 -
147
-
148
-
149
-
150
-
151
-
152
-
153
-
154
-
155
-
156
-
157
-
158
-
159
-
160
-
161
-
162
-
163
-
164
-
165
-
166
-
167
-
168
-
169
-
170
-
171
-
172
-
173
-
174
-
175
-
176
-
177
-
178
-
179
-
180
-
181
-
182
-
183
-
184
-
185
-
186
-
187
-
188
-
189
-
190
-
191
-
192
-
193
-
194
-
195
-
196
-
197
-
198
-
199
-
200
-
201
-
202
-
203
-
204
-
205
-
206
-
207
-
208
-
209
-
210
 |
 |

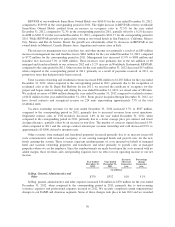
Year Ended December 31, 2011 Compared with Year Ended December 31, 2010
Continuing Operations
Year Ended
December 31,
2011
Year Ended
December 31,
2010
Increase /
(decrease)
from prior
year
Percentage
change
from prior
year
(in millions)
Owned, Leased and Consolidated Joint
Venture Hotels ...................... $1,768 $1,704 $ 64 3.8%
Management Fees, Franchise Fees and
Other Income ....................... 814 712 102 14.3%
Vacation Ownership and Residential ....... 703 538 165 30.7%
Other Revenues from Managed and
Franchised Properties ................. 2,339 2,117 222 10.5%
Total Revenues ........................ $5,624 $5,071 $553 10.9%
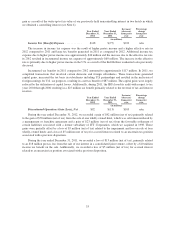
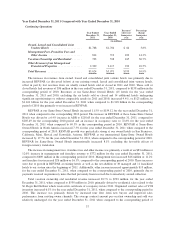
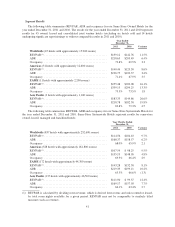
The increase in revenues from owned, leased and consolidated joint venture hotels was primarily due to
increased REVPAR (as discussed below) at our existing owned, leased and consolidated joint venture hotels,
offset in part by lost revenues from six wholly owned hotels sold or closed in 2011 and 2010. These sold or
closed hotels had revenues of $56 million in the year ended December 31, 2011, compared to $158 million in the
corresponding period of 2010. Revenues at our Same-Store Owned Hotels (45 hotels for the year ended
December 31, 2011 and 2010, excluding the six hotels sold or closed and 14 additional hotels undergoing
significant repositionings or without comparable results in 2011 and 2010) increased 9.4%, or $123 million, to
$1.441 billion for the year ended December 31, 2011 when compared to $1.318 billion in the corresponding
period of 2010 due primarily to an increase in REVPAR.
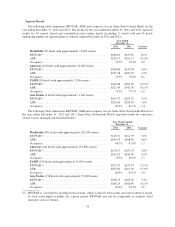
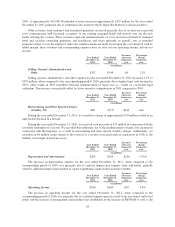
REVPAR at our Same-Store Owned Hotels increased 11.5% to $159.12 for the year ended December 31,
2011 when compared to the corresponding 2010 period. The increase in REVPAR at these Same-Store Owned
Hotels was driven by a 6.4% increase in ADR to $218.65 for the year ended December 31, 2011, compared to
$205.49 for the corresponding 2010 period and an increase in occupancy rates to 72.8% for the year ended
December 31, 2011 when compared to 69.5% in the corresponding period in 2010. REVPAR at Same-Store
Owned Hotels in North America increased 7.3% for the year ended December 31, 2011 when compared to the
corresponding period of 2010. REVPAR growth was particularly strong at our owned hotels in San Francisco,
California, Maui, Hawaii and Scottsdale, Arizona. REVPAR at our international Same-Store Owned Hotels
increased by 17.7% for the year ended December 31, 2011, when compared to the corresponding period of 2010.
REVPAR for Same-Store Owned Hotels internationally increased 8.1% excluding the favorable effects of
foreign currency translation.
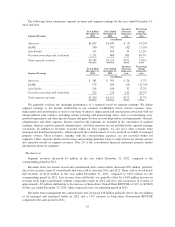
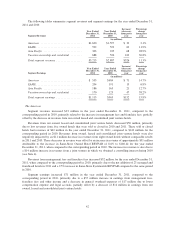
The increase in management fees, franchise fees and other income was primarily a result of an $83 million or
12.0% increase in management and franchise revenue to $772 million for the year ended December 31, 2011,
compared to $689 million in the corresponding period of 2010. Management fees increased $46 million or 11.2%
and franchise fees increased $26 million or 16.1%, compared to the corresponding period of 2010. These increases
were due to growth in REVPAR at existing hotels as well as the net addition of 38 managed and 11 franchised
hotels to our system since the beginning of 2011. Additionally, other income increased approximately $19 million,
for the year ended December 31, 2011, when compared to the corresponding period of 2010, primarily due to
payments received on promissory notes that had previously been reserved due to uncertainty around collection.
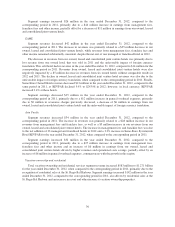
Total vacation ownership and residential revenue increased 30.7% to $703 million, for the year ended
December 31, 2011, when compared to $538 million in 2010, primarily driven by residential sales related to the
St. Regis Bal Harbour which received its certificate of occupancy in late 2011. Originated contract sales of VOI
inventory increased 6.1% for the year ended December 31, 2011, when compared to the corresponding period in
2010. This increase was primarily driven by increased tour flow from new buyers and improved sales
performance from existing owner channels. The average contract amount per vacation ownership unit sold was
relatively unchanged, for the year ended December 31, 2011 when compared to the corresponding period of
37