Starwood 2012 Annual Report Download - page 144
Download and view the complete annual report
Please find page 144 of the 2012 Starwood annual report below. You can navigate through the pages in the report by either clicking on the pages listed below, or by using the keyword search tool below to find specific information within the annual report.-
 1
1 -
2
-
3
-
4
-
5
-
6
-
7
-
8
-
9
-
10
-
11
-
12
-
13
-
14
-
15
-
16
-
17
-
18
-
19
-
20
-
21
-
22
-
23
-
24
-
25
-
26
-
27
-
28
-
29
-
30
-
31
-
32
-
33
-
34
-
35
-
36
-
37
-
38
-
39
-
40
-
41
-
42
-
43
-
44
-
45
-
46
-
47
-
48
-
49
-
50
-
51
-
52
-
53
-
54
-
55
-
56
-
57
-
58
-
59
-
60
-
61
-
62
-
63
-
64
-
65
-
66
-
67
-
68
-
69
-
70
-
71
-
72
-
73
-
74
-
75
-
76
-
77
-
78
-
79
-
80
-
81
-
82
-
83
-
84
-
85
-
86
-
87
-
88
-
89
-
90
-
91
-
92
-
93
-
94
-
95
-
96
-
97
-
98
-
99
-
100
-
101
-
102
-
103
-
104
-
105
-
106
-
107
-
108
-
109
-
110
-
111
-
112
-
113
-
114
-
115
-
116
-
117
-
118
-
119
-
120
-
121
-
122
-
123
-
124
-
125
-
126
-
127
-
128
-
129
-
130
-
131
-
132
-
133
-
 134
134 -
 135
135 -
 136
136 -
 137
137 -
 138
138 -
 139
139 -
 140
140 -
 141
141 -
 142
142 -
 143
143 -
 144
144 -
 145
145 -
 146
146 -
 147
147 -
 148
148 -
 149
149 -
 150
150 -
 151
151 -
 152
152 -
 153
153 -
 154
154 -
155
-
156
-
157
-
158
-
159
-
160
-
161
-
162
-
163
-
164
-
165
-
166
-
167
-
168
-
169
-
170
-
171
-
172
-
173
-
174
-
175
-
176
-
177
-
178
-
179
-
180
-
181
-
182
-
183
-
184
-
185
-
186
-
187
-
188
-
189
-
190
-
191
-
192
-
193
-
194
-
195
-
196
-
197
-
198
-
199
-
200
-
201
-
202
-
203
-
204
-
205
-
206
-
207
-
208
-
209
-
210
 |
 |

Cash From Investing Activities
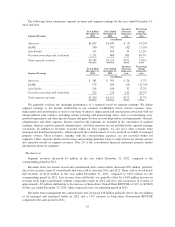
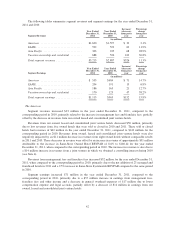
Gross capital spending during the full year ended December 31, 2012 was as follows (in millions):
Maintenance Capital Expenditures (1):
Owned, Leased and Consolidated Joint Venture Hotels .............................. $ 68
Corporate and information technology ............................................ 78
Subtotal ..................................................................... 146
Vacation Ownership and Residential Capital Expenditures:
Net capital expenditures for inventory (excluding St. Regis Bal Harbour) (2) .............. (38)
Capital expenditures for inventory — St. Regis Bal Harbour .......................... 27
Subtotal ..................................................................... (11)
Development Capital .......................................................... 271
Total Capital Expenditures ..................................................... $406
(1) Maintenance capital expenditures include renovations, asset replacements and improvements that extend the
useful life of the asset.
(2) Represents gross inventory capital expenditures of $34 million less cost of sales of $72 million.
Gross capital spending during the year ended December 31, 2012 included approximately $146 million of
maintenance capital, and $271 million of development capital. Investment spending on gross vacation ownership
interest and residential inventory was $61 million, primarily related to the completion of construction of our hotel
and residential project in Bal Harbour, Florida. Our capital expenditure program includes both offensive and
defensive capital. Defensive spending is related to maintenance and renovations that we believe are necessary to
stay competitive in the markets we are in. Other than capital to address fire and life safety issues, we consider
defensive capital to be discretionary, although reductions to this capital program could result in decreases to our
cash flow from operations, as hotels in certain markets could become less desirable. The offensive capital
expenditures, which are primarily related to new projects that we expect will generate a return, are also
considered discretionary. We currently anticipate that our defensive capital expenditures for the full year 2013
(excluding vacation ownership and residential inventory) will be approximately $200 million for maintenance,
renovations, and technology capital. In addition, for the full year 2013, we currently expect to spend
approximately $350 million for investment projects, various joint ventures and other investments.
In order to secure management or franchise agreements, we have made loans to third-party owners, minority
investments in joint ventures and provided certain guarantees and indemnifications related thereto. See Note 25
of the consolidated financial statements for discussion regarding the amount of loans we have outstanding with
owners, unfunded loan commitments, equity and other potential contributions, surety bonds outstanding,
performance guarantees and indemnifications we are obligated under, and investments in hotels and joint
ventures.
We intend to finance the acquisition of additional hotel properties (including equity investments), hotel
renovations, VOI and residential construction, capital improvements, technology spend and other core and
ancillary business acquisitions and investments and provide for general corporate purposes, (including dividend
payments and share repurchases) through our credit facility described below, the net proceeds from dispositions,
the assumption of debt, and from cash generated from operations.
We periodically review our business to identify properties or other assets that we believe either are non-core
(including hotels where the return on invested capital is not adequate), no longer complement our business, are in
markets which may not benefit us as much as other markets during an economic recovery or could be sold at
significant premiums. We are focused on enhancing real estate returns and monetizing investments.
45