Starwood 2012 Annual Report Download - page 197
Download and view the complete annual report
Please find page 197 of the 2012 Starwood annual report below. You can navigate through the pages in the report by either clicking on the pages listed below, or by using the keyword search tool below to find specific information within the annual report.STARWOOD HOTELS & RESORTS WORLDWIDE, INC.
NOTES TO FINANCIAL STATEMENTS
Approximately 0.1 million shares were issued under the ESPP during the year ended December 31, 2012 at
purchase prices ranging from $50.21 to $52.37. Approximately 0.1 million shares were issued under the ESPP
during the year ended December 31, 2011 at purchase prices ranging from $42.33 to $58.05.
Note 23. Derivative Financial Instruments
We enter into forward contracts to manage foreign exchange risk based on market conditions. We enter into
forward contracts to hedge forecasted transactions based in certain foreign currencies, including Euro, Canadian
Dollar and Yen. These forward contracts have been designated and qualify as cash flow hedges, and their change
in fair value is recorded as a component of other comprehensive income and reclassified into earnings in the
same period or periods in which the forecasted transaction occurs. To qualify as a hedge, we need to formally
document, designate and assess the effectiveness of the transactions that receive hedge accounting. The notional
dollar amount of the outstanding Euro forward contracts at December 31, 2012 are $40 million, with average
exchange rates of 1.29, with terms of primarily less than one year. We review the effectiveness of our hedging
instruments on a quarterly basis and record any ineffectiveness into earnings. We discontinue hedge accounting
for any hedge that is no longer evaluated to be highly effective. From time to time, we may choose to de-
designate portions of hedges when changes in estimates of forecasted transactions occur. Each of these hedges
was highly effective in offsetting fluctuations in foreign currencies.
We also enter into forward contracts to manage foreign exchange risk on intercompany loans that are not
deemed permanently invested. These forward contracts are not designated as hedges, and their change in fair
value is recorded in our consolidated statements of income during each reporting period.
From time to time, we enter into interest rate swap agreements to manage interest expense. The swaps
typically qualify as fair value swaps and modify our interest rate exposure by effectively converting debt with a
fixed rate to a floating rate. Our objective is to manage the impact of interest rates on the results of operations,
cash flows and the market value of our debt. At December 31, 2012, we had no interest rate swap agreements
outstanding. During the year ended December 31, 2012, in connection with the redemptions of our 6.25% Senior
Notes due 2013 and our 7.875% Senior Notes due 2014, we terminated our 2013 and 2014 interest rate swap
agreements with a total notional amount of $400 million, resulting in a gain of approximately $9 million recorded
in the loss on early extinguishment of debt, net, line item in our consolidated statements of income.
The counterparties to our derivative financial instruments are major financial institutions. We evaluate the
credit ratings of the financial institutions and believe that credit risk is at an acceptable level.
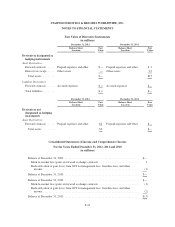
The following tables summarize the fair value of our derivative instruments, the effect of derivative
instruments on our Consolidated Statements of Comprehensive Income, the amounts reclassified from “Other
comprehensive income” and the effect on the Consolidated Statements of Income during the year.
F-40


