Starwood 2012 Annual Report Download - page 133
Download and view the complete annual report
Please find page 133 of the 2012 Starwood annual report below. You can navigate through the pages in the report by either clicking on the pages listed below, or by using the keyword search tool below to find specific information within the annual report.-
 1
1 -
2
-
3
-
4
-
5
-
6
-
7
-
8
-
9
-
10
-
11
-
12
-
13
-
14
-
15
-
16
-
17
-
18
-
19
-
20
-
21
-
22
-
23
-
24
-
25
-
26
-
27
-
28
-
29
-
30
-
31
-
32
-
33
-
34
-
35
-
36
-
37
-
38
-
39
-
40
-
41
-
42
-
43
-
44
-
45
-
46
-
47
-
48
-
49
-
50
-
51
-
52
-
53
-
54
-
55
-
56
-
57
-
58
-
59
-
60
-
61
-
62
-
63
-
64
-
65
-
66
-
67
-
68
-
69
-
70
-
71
-
72
-
73
-
74
-
75
-
76
-
77
-
78
-
79
-
80
-
81
-
82
-
83
-
84
-
85
-
86
-
87
-
88
-
89
-
90
-
91
-
92
-
93
-
94
-
95
-
96
-
97
-
98
-
99
-
100
-
101
-
102
-
103
-
104
-
105
-
106
-
107
-
108
-
109
-
110
-
111
-
112
-
113
-
114
-
115
-
116
-
117
-
118
-
119
-
120
-
121
-
122
-
 123
123 -
 124
124 -
 125
125 -
 126
126 -
 127
127 -
 128
128 -
 129
129 -
 130
130 -
 131
131 -
 132
132 -
 133
133 -
 134
134 -
 135
135 -
 136
136 -
 137
137 -
 138
138 -
 139
139 -
 140
140 -
 141
141 -
 142
142 -
 143
143 -
144
-
145
-
146
-
147
-
148
-
149
-
150
-
151
-
152
-
153
-
154
-
155
-
156
-
157
-
158
-
159
-
160
-
161
-
162
-
163
-
164
-
165
-
166
-
167
-
168
-
169
-
170
-
171
-
172
-
173
-
174
-
175
-
176
-
177
-
178
-
179
-
180
-
181
-
182
-
183
-
184
-
185
-
186
-
187
-
188
-
189
-
190
-
191
-
192
-
193
-
194
-
195
-
196
-
197
-
198
-
199
-
200
-
201
-
202
-
203
-
204
-
205
-
206
-
207
-
208
-
209
-
210
 |
 |

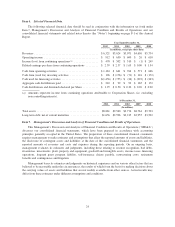
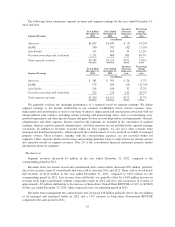
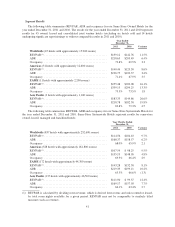
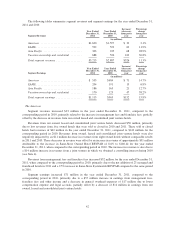
Segment Results
The following table summarizes REVPAR, ADR and occupancy for our Same-Store Owned Hotels for the
year ended December 31, 2012 and 2011. The results for the year ended December 31, 2012 and 2011 represent
results for 39 owned, leased and consolidated joint venture hotels (excluding 11 hotels sold and 14 hotels
undergoing significant repositionings or without comparable results in 2012 and 2011).
Year Ended
December 31,
2012 2011 Variance
Worldwide (39 hotels with approximately 13,400 rooms)
REVPAR (1) ............................................ $160.01 $159.85 0.1%
ADR ................................................. $220.71 $221.17 (0.2)%
Occupancy ............................................ 72.5% 72.3% 0.2
Americas (25 hotels with approximately 10,000 rooms)
REVPAR (1) ............................................ $138.06 $135.38 2.0%
ADR ................................................. $195.78 $192.22 1.9%
Occupancy ............................................ 70.5% 70.4% 0.1
EAME (10 hotels with approximately 2,100 rooms)
REVPAR (1) ............................................ $243.98 $259.18 (5.9)%
ADR ................................................. $321.49 $342.36 (6.1)%
Occupancy ............................................ 75.9% 75.7% 0.2
Asia Pacific (4 hotels with approximately 1,300 rooms)
REVPAR (1) ............................................ $191.37 $185.35 3.2%
ADR ................................................. $232.06 $228.50 1.6%
Occupancy ............................................ 82.5% 81.1% 1.4
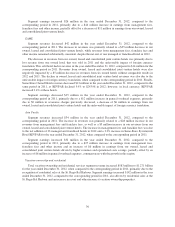
The following table summarizes REVPAR, ADR and occupancy for our Same-Store Systemwide Hotels for
the year ended December 31, 2012 and 2011. Same-Store Systemwide Hotels represent results for same-store
owned, leased, managed and franchised hotels.
Year Months Ended
December 31,
2012 2011 Variance
Worldwide (901 hotels with approximately 265,900 rooms)
REVPAR (1) ............................................ $116.51 $112.93 3.2%
ADR ................................................. $169.55 $168.49 0.6%
Occupancy ............................................ 68.7% 67.0% 1.7
Americas (544 hotels with approximately 163,800 rooms)
REVPAR (1) ............................................ $114.17 $107.93 5.8%
ADR ................................................. $161.02 $156.05 3.2%
Occupancy ............................................ 70.9% 69.2% 1.7
EAME (199 hotels with approximately 50,100 rooms)
REVPAR (1) ............................................ $132.37 $137.47 (3.7)%
ADR ................................................. $203.82 $215.18 (5.3)%
Occupancy ............................................ 64.9% 63.9% 1.0
Asia Pacific (158 hotels with approximately 52,000 rooms)
REVPAR (1) ............................................ $108.79 $105.36 3.3%
ADR ................................................. $166.29 $166.49 (0.1)%
Occupancy ............................................ 65.4% 63.3% 2.1
(1) REVPAR is calculated by dividing room revenue, which is derived from rooms and suites rented or leased,
by total room nights available for a given period. REVPAR may not be comparable to similarly titled
measures such as revenues.
34