Starwood 2012 Annual Report Download - page 48
Download and view the complete annual report
Please find page 48 of the 2012 Starwood annual report below. You can navigate through the pages in the report by either clicking on the pages listed below, or by using the keyword search tool below to find specific information within the annual report.
STARWOOD HOTELS & RESORTS WORLDWIDE, INC.-2013Proxy Statement42
EXECUTIVE COMPENSATION
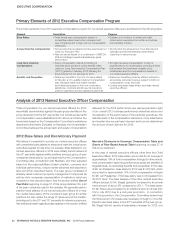
Primary Elements of 2012 Executive Compensation Program
The primary elements of our 2012 executive compensation program for our named executive offi cers are summarized in the following table:
Element Description Purpose
Base Salary •Fixed annual cash compensation based on
competitive market levels when compared with
peer companies and to align with our compensation
philosophy
•Enables us to continue to attract and retain
critical senior executives from within and outside
thehospitality industry
Annual Incentive Compensation •Annual performance-based incentive awards earned
under our Executive Plan
•Payouts earned based on a combination of EBITDA,
EPS and strategic/operational/leadership goals
performance
•Directly links the achievement of our fi nancial and
strategic/operational/leadership performance
objectives toexecutive pay
Long-Term Incentive
Compensation
•Equity compensation awards (consisting of
restricted stock and stock option awards made
under our Long-Term Incentive Compensation Plan
(“LTIP”)) granted in February2012 following the
announcement of our earnings for 2011
•Strongly ties equity compensation to returns
experienced by our stockholders, providing adirect
link between the investment interests of our
stockholders and the compensation interests of
ournamed executive offi cers
Benefi ts and Perquisites •Retirement benefi ts in the form of a tax-qualifi ed
401(k) plan, a non-qualifi ed deferred compensation
plan, standard health and welfare benefi ts,
and limited perquisites in the form of relocation
assistance, corporate aircraft use, life insurance
premium payments and tax assistance payments
•Retirement benefi ts provide tax effi cient vehicles to
accumulate retirement savings, subject to limits on
compensation under the Code
•Limited perquisites helps attract and retain named
executive offi cers
Analysis of 2012 Named Executive Offi cer Compensation
Total compensation for our named executive offi cers for 2012
was initially benchmarked against the peer group identifi ed in this
proxy statement at the 50
th
percentile, but individual elements
of compensation were established both above and below the
benchmark based on the Compensation Committee’s evaluations
described further below. Evaluated on this basis, the Compensation
Committee believes the actual cash and equity compensation
delivered for the 2012 performance year was appropriate in light
of our overall 2012 business performance described above and
its evaluation of the performance of the particular executives. We
describe each of the compensation elements in more detail below
and explain why we paid each element and how we determined
the amount of each element for 2012.
2012 Base Salary and Discretionary Payment
We believe it is essential to provide our named executive offi cers
with competitive base salaries to attract and retain the critical senior
executives needed to help drive our success. Base salaries for our
named executive offi cers in 2012 were initially benchmarked at
the 50th percentile against similar positions among a group of peer
companies developed by us and approved by the Compensation
Committee after consultation with Meridian, and then adjusted
based on the responsibilities of each position, company and
individual performance, unique market demands and experience
level as further described below. The peer group consisted of
similarly-sized hotel and property management companies as
well as other companies representative of markets in which we
compete for key executive talent. See the section entitled Use of
Peer Data beginning on page 51 of this proxy statement for a list
of the peer companies used in this analysis. We generally seek to
position base salaries of our named executive offi cers at or near
the median base salary of the Company’s peer group for similar
positions but also review the range of values around the median,
including out to the 25th and 75th percentile for reference purposes.
See additional detail regarding base salaries in the section entitled
Narrative Disclosure to Summary Compensation Table and
Grants of Plan-Based Awards Table beginning on page 57 of
this proxy statement.
In the case of named executive offi cers other than the Chief
Executive Offi cer, 2012 base salary accounted for an average of
approximately 19% of total compensation at target (in other words,
total compensation assuming performance goals are satisfi ed at
targeted levels, but excluding benefi ts and perquisites). In the case
of Mr. van Paasschen, base salary for 2012 was $1,250,000, which
accounted for approximately 14% of total compensation at target
for Mr. van Paasschen. This base salary was not increased from
its 2011 level. The base salaries of the other named executive
offi cers (except for Mr. Siegel) generally increased by an annual
merit amount of about 2% compared to 2011. The base salary
for Mr. Rivera was increased by an additional amount of less than
5% in July 2012 due to a mid-year promotion. In connection
with this promotion, the Compensation Committee determined
that this amount of increase was necessary to begin to move Mr.
Rivera’s new base salary to the 50th percentile of the peer group.
Mr. Siegel did not receive a base salary increase for 2012, but


