Starwood 2012 Annual Report Download - page 167
Download and view the complete annual report
Please find page 167 of the 2012 Starwood annual report below. You can navigate through the pages in the report by either clicking on the pages listed below, or by using the keyword search tool below to find specific information within the annual report.-
 1
1 -
2
-
3
-
4
-
5
-
6
-
7
-
8
-
9
-
10
-
11
-
12
-
13
-
14
-
15
-
16
-
17
-
18
-
19
-
20
-
21
-
22
-
23
-
24
-
25
-
26
-
27
-
28
-
29
-
30
-
31
-
32
-
33
-
34
-
35
-
36
-
37
-
38
-
39
-
40
-
41
-
42
-
43
-
44
-
45
-
46
-
47
-
48
-
49
-
50
-
51
-
52
-
53
-
54
-
55
-
56
-
57
-
58
-
59
-
60
-
61
-
62
-
63
-
64
-
65
-
66
-
67
-
68
-
69
-
70
-
71
-
72
-
73
-
74
-
75
-
76
-
77
-
78
-
79
-
80
-
81
-
82
-
83
-
84
-
85
-
86
-
87
-
88
-
89
-
90
-
91
-
92
-
93
-
94
-
95
-
96
-
97
-
98
-
99
-
100
-
101
-
102
-
103
-
104
-
105
-
106
-
107
-
108
-
109
-
110
-
111
-
112
-
113
-
114
-
115
-
116
-
117
-
118
-
119
-
120
-
121
-
122
-
123
-
124
-
125
-
126
-
127
-
128
-
129
-
130
-
131
-
132
-
133
-
134
-
135
-
136
-
137
-
138
-
139
-
140
-
141
-
142
-
143
-
144
-
145
-
146
-
147
-
148
-
149
-
150
-
151
-
152
-
153
-
154
-
155
-
156
-
 157
157 -
 158
158 -
 159
159 -
 160
160 -
 161
161 -
 162
162 -
 163
163 -
 164
164 -
 165
165 -
 166
166 -
 167
167 -
 168
168 -
 169
169 -
 170
170 -
 171
171 -
 172
172 -
 173
173 -
 174
174 -
 175
175 -
 176
176 -
 177
177 -
178
-
179
-
180
-
181
-
182
-
183
-
184
-
185
-
186
-
187
-
188
-
189
-
190
-
191
-
192
-
193
-
194
-
195
-
196
-
197
-
198
-
199
-
200
-
201
-
202
-
203
-
204
-
205
-
206
-
207
-
208
-
209
-
210
 |
 |
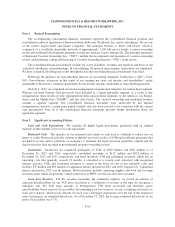
STARWOOD HOTELS & RESORTS WORLDWIDE, INC.
NOTES TO FINANCIAL STATEMENTS
Note 1. Basis of Presentation
The accompanying consolidated financial statements represent the consolidated financial position and
consolidated results of operations of Starwood Hotels & Resorts Worldwide, Inc. and its subsidiaries. We are one
of the world’s largest hotel and leisure companies. Our principal business is hotels and leisure, which is
comprised of a worldwide hospitality network of approximately 1,100 full-service hotels, vacation ownership
resorts and residential developments primarily serving two markets: luxury and upscale. The principal operations
of Starwood Vacation Ownership, Inc. (“SVO”) include the development and operation of vacation ownership
resorts; and marketing, selling and financing of vacation ownership interests (“VOIs”) in the resorts.
The consolidated financial statements include our assets, liabilities, revenues and expenses and those of our
controlled subsidiaries and partnerships. In consolidating, all material intercompany transactions are eliminated.
We have evaluated all subsequent events through the date the consolidated financial statements were filed.
Following the guidance for noncontrolling interests in Accounting Standards Codification (“ASC”) Topic
810, Consolidation, references in this report to our earnings per share, net income, and shareholders’ equity
attributable to Starwood’s common shareholders do not include amounts attributable to noncontrolling interests.
On July 1, 2012, we completed an internal management reorganization related to our former hotel segment.
Whereas our hotel business had previously been included in a single reportable segment, as a result of this
reorganization, these results are now segregated into three separate hotel segments: (i) the Americas, (ii) Europe,
Africa and the Middle East (“EAME”), and (iii) Asia Pacific. The vacation ownership and residential business
remains a separate segment. Our consolidated financial statements were unaffected by this internal
reorganization; however, certain prior period footnote data has been restated to be consistent with the current
year presentation. Note 26 to the consolidated financial statements presents further information about our
reportable segments.
Note 2. Significant Accounting Policies
Cash and Cash Equivalents.We consider all highly liquid investments purchased with an original
maturity of three months or less to be cash equivalents.
Restricted Cash. The majority of our restricted cash relates to cash used as collateral to reduce fees on
letters of credit. Restricted cash also consists of deposits received on sales of VOIs and residential properties that
are held in escrow until a certificate of occupancy is obtained, the legal rescission period has expired and the
deed of trust has been recorded in governmental property ownership records.
Inventories.Inventories are comprised principally of VOIs of $220 million and $261 million as of
December 31, 2012 and 2011, respectively, residential inventory of $112 million and $521 million at
December 31, 2012 and 2011, respectively, and hotel inventory. VOI and residential inventory, which has an
operating cycle that generally exceeds 12 months, is classified as a current asset consistent with recognized
industry practice. VOIs and residential inventory is carried at the lower of cost or net realizable value and
includes $37 million and $29 million of capitalized interest incurred in 2011 and 2010, respectively. Capitalized
interest incurred in 2012 was de minimis. Hotel inventory includes operating supplies and food and beverage
inventory items which are generally valued at the lower of FIFO cost (first-in, first-out) or market.
Loan Loss Reserves. For the vacation ownership and residential segment, we record an estimate of
expected uncollectibility on our VOI notes receivable as a reduction of revenue at the time we recognize a
timeshare sale. We hold large amounts of homogeneous VOI notes receivable and therefore assess
uncollectibility based on pools of receivables. In estimating loan loss reserves, we use a technique referred to as
static pool analysis, which tracks defaults for each year’s mortgage originations over the life of the respective
notes and projects an estimated default rate. As of December 31, 2012, the average estimated default rate of our
pools of receivables was 9.7%.
F-10