Starwood 2012 Annual Report Download - page 207
Download and view the complete annual report
Please find page 207 of the 2012 Starwood annual report below. You can navigate through the pages in the report by either clicking on the pages listed below, or by using the keyword search tool below to find specific information within the annual report.-
 1
1 -
2
-
3
-
4
-
5
-
6
-
7
-
8
-
9
-
10
-
11
-
12
-
13
-
14
-
15
-
16
-
17
-
18
-
19
-
20
-
21
-
22
-
23
-
24
-
25
-
26
-
27
-
28
-
29
-
30
-
31
-
32
-
33
-
34
-
35
-
36
-
37
-
38
-
39
-
40
-
41
-
42
-
43
-
44
-
45
-
46
-
47
-
48
-
49
-
50
-
51
-
52
-
53
-
54
-
55
-
56
-
57
-
58
-
59
-
60
-
61
-
62
-
63
-
64
-
65
-
66
-
67
-
68
-
69
-
70
-
71
-
72
-
73
-
74
-
75
-
76
-
77
-
78
-
79
-
80
-
81
-
82
-
83
-
84
-
85
-
86
-
87
-
88
-
89
-
90
-
91
-
92
-
93
-
94
-
95
-
96
-
97
-
98
-
99
-
100
-
101
-
102
-
103
-
104
-
105
-
106
-
107
-
108
-
109
-
110
-
111
-
112
-
113
-
114
-
115
-
116
-
117
-
118
-
119
-
120
-
121
-
122
-
123
-
124
-
125
-
126
-
127
-
128
-
129
-
130
-
131
-
132
-
133
-
134
-
135
-
136
-
137
-
138
-
139
-
140
-
141
-
142
-
143
-
144
-
145
-
146
-
147
-
148
-
149
-
150
-
151
-
152
-
153
-
154
-
155
-
156
-
157
-
158
-
159
-
160
-
161
-
162
-
163
-
164
-
165
-
166
-
167
-
168
-
169
-
170
-
171
-
172
-
173
-
174
-
175
-
176
-
177
-
178
-
179
-
180
-
181
-
182
-
183
-
184
-
185
-
186
-
187
-
188
-
189
-
190
-
191
-
192
-
193
-
194
-
195
-
196
-
 197
197 -
 198
198 -
 199
199 -
 200
200 -
 201
201 -
 202
202 -
 203
203 -
 204
204 -
 205
205 -
 206
206 -
 207
207 -
 208
208 -
 209
209 -
 210
210
 |
 |

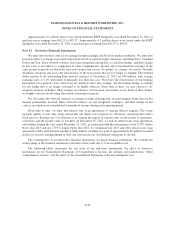
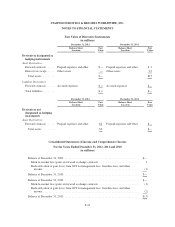
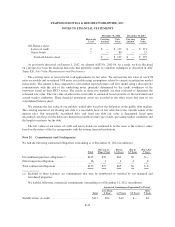
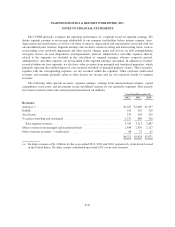
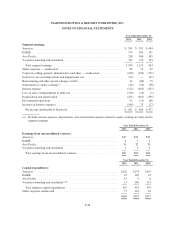
STARWOOD HOTELS & RESORTS WORLDWIDE, INC.
NOTES TO FINANCIAL STATEMENTS
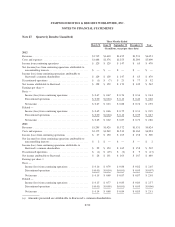
Note 27. Quarterly Results (Unaudited)
Three Months Ended
March 31 June 30 September 30 December 31 Year
(In millions, except per share data)
2012
Revenues ........................................... $1,715 $1,618 $1,455 $1,533 $6,321
Costs and expenses ................................... $1,488 $1,376 $1,255 $1,290 $5,409
Income from continuing operations ...................... $ 129 $ 129 $ 147 $ 65 $ 470
Net (income) loss from continuing operations attributable to
noncontrolling interests .............................. $ — $ — $ — $ — $ —
Income (loss) from continuing operations attributable to
Starwood’s common shareholders ..................... $ 129 $ 129 $ 147 $ 65 $ 470
Discontinued operations ............................... $ (1) $ (7) $ 23 $ 77 $ 92
Net income attributable to Starwood ...................... $ 128 $ 122 $ 170 $ 142 $ 562
Earnings per share (a)
Basic —
Income (loss) from continuing operations ............... $ 0.67 $ 0.67 $ 0.76 $ 0.34 $ 2.44
Discontinued operations ............................. $ 0.00 $ (0.04) $ 0.12 $ 0.40 $ 0.48
Net income ....................................... $ 0.67 $ 0.63 $ 0.88 $ 0.74 $ 2.92
Diluted —
Income (loss) from continuing operations ............... $ 0.65 $ 0.66 $ 0.75 $ 0.33 $ 2.39
Discontinued operations ............................. $ 0.00 $ (0.04) $ 0.12 $ 0.39 $ 0.47
Net income ....................................... $ 0.65 $ 0.62 $ 0.87 $ 0.72 $ 2.86
2011
Revenues ........................................... $1,295 $1,426 $1,372 $1,531 $5,624
Costs and expenses ................................... $1,175 $1,249 $1,210 $1,360 $4,994
Income (loss) from continuing operations ................. $ 27 $ 150 $ 165 $ 158 $ 500
Net (income) loss from continuing operations attributable to
noncontrolling interests .............................. $ 2 $ — $ — $ — $ 2
Income (loss) from continuing operations attributable to
Starwood’s common shareholders ..................... $ 29 $ 150 $ 165 $ 158 $ 502
Discontinued operations ............................... $ (1) $ (19) $ (2) $ 9 $ (13)
Net income attributable to Starwood ...................... $ 28 $ 131 $ 163 $ 167 $ 489
Earnings per share (a)
Basic —
Income (loss) from continuing operations ............... $ 0.16 $ 0.79 $ 0.88 $ 0.82 $ 2.65
Discontinued operations ............................. $(0.01) $ (0.10) $ (0.01) $ 0.05 $ (0.07)
Net income ....................................... $ 0.15 $ 0.69 $ 0.87 $ 0.87 $ 2.58
Diluted —
Income (loss) from continuing operations ............... $ 0.15 $ 0.77 $ 0.85 $ 0.80 $ 2.57
Discontinued operations ............................. $(0.01) $ (0.09) $ (0.01) $ 0.05 $ (0.06)
Net income ....................................... $ 0.14 $ 0.68 $ 0.84 $ 0.85 $ 2.51
(a) Amounts presented are attributable to Starwood’s common shareholders.
F-50