Starwood 2012 Annual Report Download - page 206
Download and view the complete annual report
Please find page 206 of the 2012 Starwood annual report below. You can navigate through the pages in the report by either clicking on the pages listed below, or by using the keyword search tool below to find specific information within the annual report.-
 1
1 -
2
-
3
-
4
-
5
-
6
-
7
-
8
-
9
-
10
-
11
-
12
-
13
-
14
-
15
-
16
-
17
-
18
-
19
-
20
-
21
-
22
-
23
-
24
-
25
-
26
-
27
-
28
-
29
-
30
-
31
-
32
-
33
-
34
-
35
-
36
-
37
-
38
-
39
-
40
-
41
-
42
-
43
-
44
-
45
-
46
-
47
-
48
-
49
-
50
-
51
-
52
-
53
-
54
-
55
-
56
-
57
-
58
-
59
-
60
-
61
-
62
-
63
-
64
-
65
-
66
-
67
-
68
-
69
-
70
-
71
-
72
-
73
-
74
-
75
-
76
-
77
-
78
-
79
-
80
-
81
-
82
-
83
-
84
-
85
-
86
-
87
-
88
-
89
-
90
-
91
-
92
-
93
-
94
-
95
-
96
-
97
-
98
-
99
-
100
-
101
-
102
-
103
-
104
-
105
-
106
-
107
-
108
-
109
-
110
-
111
-
112
-
113
-
114
-
115
-
116
-
117
-
118
-
119
-
120
-
121
-
122
-
123
-
124
-
125
-
126
-
127
-
128
-
129
-
130
-
131
-
132
-
133
-
134
-
135
-
136
-
137
-
138
-
139
-
140
-
141
-
142
-
143
-
144
-
145
-
146
-
147
-
148
-
149
-
150
-
151
-
152
-
153
-
154
-
155
-
156
-
157
-
158
-
159
-
160
-
161
-
162
-
163
-
164
-
165
-
166
-
167
-
168
-
169
-
170
-
171
-
172
-
173
-
174
-
175
-
176
-
177
-
178
-
179
-
180
-
181
-
182
-
183
-
184
-
185
-
186
-
187
-
188
-
189
-
190
-
191
-
192
-
193
-
194
-
195
-
 196
196 -
 197
197 -
 198
198 -
 199
199 -
 200
200 -
 201
201 -
 202
202 -
 203
203 -
 204
204 -
 205
205 -
 206
206 -
 207
207 -
 208
208 -
 209
209 -
 210
210
 |
 |

STARWOOD HOTELS & RESORTS WORLDWIDE, INC.
NOTES TO FINANCIAL STATEMENTS
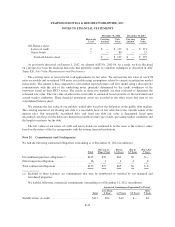
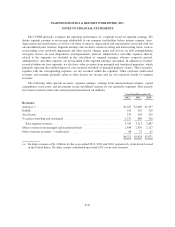
(a) Represents gross inventory capital expenditures less cost of sales of $(11) million, $90 million and
$112 million for the years ended 2012, 2011 and 2010, respectively. Additionally, includes development
capital of $24 million, $56 million and $39 million for the years ended 2012, 2011 and 2010, respectively.
(b) Amounts presented for the years ended 2012 and 2011 exclude costs of sales of Bal Harbour of $440 million
and $76 million, respectively.
December 31,
2012 2011 2010
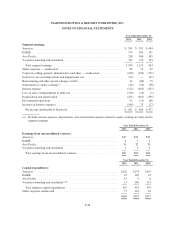
Assets:
Americas ............................................................. $2,229 $2,307 $2,543
EAME ............................................................... 911 830 882
Asia Pacific .......................................................... 574 610 594
Vacation ownership and residential ........................................ 1,445 2,056 1,989
Total segment assets (a) ................................................ 5,159 5,803 6,008
Other corporate assets .................................................. 3,702 3,757 3,768
$8,861 $9,560 $9,776
(a) Includes long-lived assets of $1.6 billion, $1.8 billion and $2.0 billion at December 31, 2012, 2011 and
2010, respectively, located in the United States. As well, includes long-lived assets of $366 million, $330
million and $324 million at December 31, 2012, 2011 and 2010, respectively, located in Italy. No other
country contributed more than 10% of our total long-lived assets.
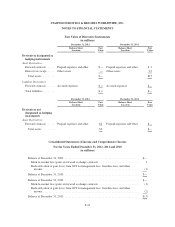
December 31,
2012 2011 2010
Investments in unconsolidated ventures:
Americas ................................................................. $ 71 $ 70 $ 77
EAME ................................................................... 25 22 37
Asia Pacific ............................................................... 143 137 171
Vacation ownership and residential ............................................ 21 30 27
Total investments in unconsolidated ventures .................................. $260 $259 $312
F-49