PNC Bank 2001 Annual Report Download - page 97
Download and view the complete annual report
Please find page 97 of the 2001 PNC Bank annual report below. You can navigate through the pages in the report by either clicking on the pages listed below, or by using the keyword search tool below to find specific information within the annual report.-
 1
1 -
2
-
3
-
4
-
5
-
6
-
7
-
8
-
9
-
10
-
11
-
12
-
13
-
14
-
15
-
16
-
17
-
18
-
19
-
20
-
21
-
22
-
23
-
24
-
25
-
26
-
27
-
28
-
29
-
30
-
31
-
32
-
33
-
34
-
35
-
36
-
37
-
38
-
39
-
40
-
41
-
42
-
43
-
44
-
45
-
46
-
47
-
48
-
49
-
50
-
51
-
52
-
53
-
54
-
55
-
56
-
57
-
58
-
59
-
60
-
61
-
62
-
63
-
64
-
65
-
66
-
67
-
68
-
69
-
70
-
71
-
72
-
73
-
74
-
75
-
76
-
77
-
78
-
79
-
80
-
81
-
82
-
83
-
84
-
85
-
86
-
 87
87 -
 88
88 -
 89
89 -
 90
90 -
 91
91 -
 92
92 -
 93
93 -
 94
94 -
 95
95 -
 96
96 -
 97
97 -
 98
98 -
 99
99 -
 100
100 -
 101
101 -
 102
102 -
 103
103 -
 104
104
 |
 |

95
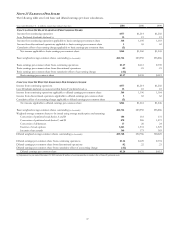
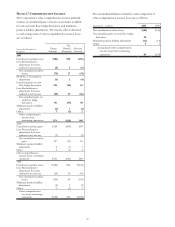
ANALYSIS OF YEAR-TO-YEAR CHANGES IN NET INTEREST INCOME
2001/2000 2000/1999
Increase/(Decrease) in Income/Expense
Due to Changes in:
Increase/(Decrease) in Income/Expense
Due to Changes in:
Taxable-equivalent basis - in millions Volume Rate Total Volume Rate Total
INTEREST-EARNING ASSETS
Loans held for sale $(35) $(50) $(85) $90 $10 $100
Securities
Securities available for sale
U.S. Treasury, government agencies and
corporations 117 (5) 112 (12) 8 (4)
Other debt 184 (32) 152 19 10 29
Other (37) 5 (32) (7) 5 (2)
Total securities available for sale 276 (44) 232 (1) 24 23
Securities held to maturity 66
Total securities 281 (43) 238 (1) 24 23
Loans, net of unearned income
Commercial (162) (259) (421) (112) 159 47
Commercial real estate (9) (47) (56) (58) 33 (25)
Consumer (7) (52) (59) (96) 43 (53)
Residential mortgage (275) 10 (265) 25 16 41
Lease financing 70 (12) 58 48 5 53
Credit card (100) (100)
Other (14) (11) (25) 10 5 15
Total loans, net of unearned income (399) (369) (768) (221) 199 (22)
Other 24 (6) 18 14 30 44
Total interest-earning assets (42) (555) (597) (108) 253 145
INTEREST-BEARING LIABILITIES
Interest-bearing deposits
Demand and money market 82 (234) (152) 56 109 165
Savings (2) (16) (18) (6) 3 (3)
Retail certificates of deposit (124) (68) (192) 22 96 118
Other time (6) (6) (56) 11 (45)
Deposits in foreign offices (34) (22) (56) 36 13 49
Total interest-bearing deposits (27) (397) (424) 63 221 284
Borrowed funds
Federal funds purchased (5) (39) (44) 27 24 51
Repurchase agreements 11 (23) (12) 8614
Bank notes and senior debt (60) (106) (166) (119) 93 (26)
Federal Home Loan Bank borrowings 48 (33) 15 (49) 12 (37)
Subordinated debt (3) (38) (41) 26 (1) 25
Other borrowed funds (36) 15 (21) 71118
Total borrowed funds (18) (251) (269) (103) 148 45
Total interest-bearing liabilities (43) (650) (693) (5) 334 329
Change in net interest income $(20) $116 $96 $(53) $(131) $(184)
Changes attributable to rate/volume are prorated into rate and volume components.