PNC Bank 2001 Annual Report Download - page 61
Download and view the complete annual report
Please find page 61 of the 2001 PNC Bank annual report below. You can navigate through the pages in the report by either clicking on the pages listed below, or by using the keyword search tool below to find specific information within the annual report.-
 1
1 -
2
-
3
-
4
-
5
-
6
-
7
-
8
-
9
-
10
-
11
-
12
-
13
-
14
-
15
-
16
-
17
-
18
-
19
-
20
-
21
-
22
-
23
-
24
-
25
-
26
-
27
-
28
-
29
-
30
-
31
-
32
-
33
-
34
-
35
-
36
-
37
-
38
-
39
-
40
-
41
-
42
-
43
-
44
-
45
-
46
-
47
-
48
-
49
-
50
-
 51
51 -
 52
52 -
 53
53 -
 54
54 -
 55
55 -
 56
56 -
 57
57 -
 58
58 -
 59
59 -
 60
60 -
 61
61 -
 62
62 -
 63
63 -
 64
64 -
 65
65 -
 66
66 -
 67
67 -
 68
68 -
 69
69 -
 70
70 -
 71
71 -
72
-
73
-
74
-
75
-
76
-
77
-
78
-
79
-
80
-
81
-
82
-
83
-
84
-
85
-
86
-
87
-
88
-
89
-
90
-
91
-
92
-
93
-
94
-
95
-
96
-
97
-
98
-
99
-
100
-
101
-
102
-
103
-
104
 |
 |
59
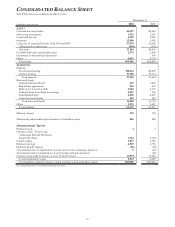
CONSOLIDATED BALANCE SHEET REVIEW
Loans
Loans were $50.6 billion at December 31, 2000, a $928
million increase from year-end 1999 as increases in
residential mortgage loans and lease financing more than
offset lower consumer, commercial and commercial real
estate loans.
Loans Held For Sale
Loans held for sale were $1.7 billion at December 31, 2000
compared with $3.5 billion at December 31, 1999. The
decrease was primarily due to dispositions of loans
designated for exit.
Securities Available For Sale
The fair value of securities available for sale at December 31,
2000 was $5.9 billion compared with $6.0 billion as of
December 31, 1999. Securities represented 8% of total assets
at December 31, 2000 and 9% at December 31, 1999. The
expected weighted-average life of securities available for sale
was 4 years and 5 months at December 31, 2000 and 4 years
and 7 months at year-end 1999.
Funding Sources
Total funding sources were $59.4 billion at December 31,
2000 and $60.0 billion at December 31, 1999. Increases in
demand and money market deposits allowed PNC to reduce
higher-costing funding sources including deposits in foreign
offices, Federal Home Loan Bank borrowings and bank
notes and senior debt.
Total deposits were $47.7 billion at December 31, 2000
compared to $45.8 billion at December 31, 1999. Increases in
demand and money market deposits, as a result of strategic
marketing initiatives to grow more valuable transaction
accounts, were partially offset by a decrease in deposits in
foreign offices.
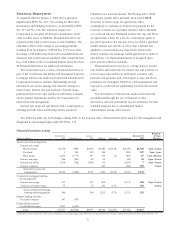
Asset Quality
The ratio of nonperforming assets to total loans, loans held
for sale and foreclosed assets was .71% at December 31,
2000 and .61% at December 31, 1999. Nonperforming assets
were $372 million at December 31, 2000 compared with
$325 million at December 31, 1999. The allowance for credit
losses was $675 million and represented 209% of nonaccrual
loans and 1.33% of total loans at December 31, 2000. The
comparable amounts were $674 million, 232% and 1.36%,
respectively, at December 31, 1999.
Capital
Shareholders’ equity totaled $6.7 billion and $5.9 billion at
December 31, 2000 and 1999, respectively, and the leverage
ratio was 8.0% and 6.6%, respectively, in the comparison.
Tier I and total risk-based capital ratios were 8.6% and
12.6%, respectively, at December 31, 2000, compared with
7.1% and 11.1%, respectively, at December 31, 1999,
computed on a basis including discontinued operations.