PNC Bank 2001 Annual Report Download - page 55
Download and view the complete annual report
Please find page 55 of the 2001 PNC Bank annual report below. You can navigate through the pages in the report by either clicking on the pages listed below, or by using the keyword search tool below to find specific information within the annual report.-
 1
1 -
2
-
3
-
4
-
5
-
6
-
7
-
8
-
9
-
10
-
11
-
12
-
13
-
14
-
15
-
16
-
17
-
18
-
19
-
20
-
21
-
22
-
23
-
24
-
25
-
26
-
27
-
28
-
29
-
30
-
31
-
32
-
33
-
34
-
35
-
36
-
37
-
38
-
39
-
40
-
41
-
42
-
43
-
44
-
 45
45 -
 46
46 -
 47
47 -
 48
48 -
 49
49 -
 50
50 -
 51
51 -
 52
52 -
 53
53 -
 54
54 -
 55
55 -
 56
56 -
 57
57 -
 58
58 -
 59
59 -
 60
60 -
 61
61 -
 62
62 -
 63
63 -
 64
64 -
 65
65 -
66
-
67
-
68
-
69
-
70
-
71
-
72
-
73
-
74
-
75
-
76
-
77
-
78
-
79
-
80
-
81
-
82
-
83
-
84
-
85
-
86
-
87
-
88
-
89
-
90
-
91
-
92
-
93
-
94
-
95
-
96
-
97
-
98
-
99
-
100
-
101
-
102
-
103
-
104
 |
 |

53
FINANCIAL DERIVATIVES
As required, effective January 1, 2001, the Corporation
implemented SFAS No. 133, “Accounting for Derivative
Instruments and Hedging Activities,” as amended by SFAS
No. 137 and No. 138. The statement requires the
Corporation to recognize all derivative instruments at fair
value as either assets or liabilities. Financial derivatives are
reported at fair value in other assets or other liabilities. The
cumulative effect of the change in accounting principle
resulting from the adoption of SFAS No. 133 was an after-
tax charge of $5 million reported in the consolidated income
statement and an after-tax accumulated other comprehensive
loss of $4 million in the consolidated balance sheet. See Note
20 Financial Derivatives for additional information.
The Corporation uses a variety of financial derivatives as
part of the overall asset and liability risk management process
to manage interest rate, market and credit risk inherent in the
Corporation’s business activities. Substantially all such
instruments are used to manage risk related to changes in
interest rates. Interest rate and total rate of return swaps,
purchased interest rate caps and floors and futures contracts
are the primary instruments used by the Corporation for
interest rate risk management.
Interest rate swaps are agreements with a counterparty to
exchange periodic fixed and floating interest payments
calculated on a notional amount. The floating rate is based
on a money market index, primarily short-term LIBOR.
Total rate of return swaps are agreements with a
counterparty to exchange an interest rate payment for the
total rate of return on a specified reference index calculated
on a notional amount. Purchased interest rate caps and floors
are agreements where, for a fee, the counterparty agrees to
pay the Corporation the amount, if any, by which a specified
market interest rate exceeds or is less than a defined rate
applied to a notional amount, respectively. Interest rate
futures contracts are exchange-traded agreements to make or
take delivery of a financial instrument at an agreed upon
price and are settled in cash daily.
Financial derivatives involve, to varying degrees, interest
rate, market and credit risk. For interest rate and total rate of
return swaps, caps and floors and futures contracts, only
periodic cash payments and, with respect to caps and floors,
premiums, are exchanged. Therefore, cash requirements and
exposure to credit risk are significantly less than the notional
value.
Not all elements of interest rate, market and credit risk
are addressed through the use of financial or other
derivatives, and such instruments may be ineffective for their
intended purposes due to unanticipated market
characteristics among other reasons.
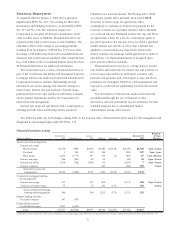
The following table sets forth changes, during 2001, in the notional value of financial derivatives used for risk management and
designated as accounting hedges under SFAS No. 133.
Financial Derivatives Activity
December 31 January 1 December 31
Weighted-
Average
Dollars in millions 2000 Adjustments (a) 2001 Additions Maturities Terminations 2001 Maturity
Interest rate risk management
Interest rate swa
p
s
Receive fixed $4,756 $180 $4,936 $6,300 $(2,118) $(2,370) $6,748 3
y
rs. 2 mos.
Pay fixed 1 248 249 248 (390) 107 4
y
rs. 1 mo.
Basis swa
p
s 2,230 (1,773) 457 235 (5) (600) 87 6
y
rs. 10 mos.
Interest rate ca
p
s 308 (243) 65 44 (84) 25 4
y
rs. 4 mos.
Interest rate floors 3,238 (238) 3,000 60 (3,053) 73
y
rs. 4 mos.
Futures contracts 642 (244) 398 7 mos.
Total interest rate risk
management 10,533 (1,826) 8,707 7,529 (2,123) (6,741) 7,372
Commercial mortgage banking
risk management
Interest rate swa
p
s 311 311 965 (1,171) 105 9
y
rs. 9 mos.
T
otal rate of return swa
p
s 75 75 250 (175) 150 2 mos.
Total commercial mortgage
banking risk management 386 386 1,215 (175) (1,171) 255
Student lending activities
Forward contracts 347 (347)
Credit-related activities
Credit default swaps 4,391 (4,391)
T
ota
l
$15,657 $(6,564) $9,093 $8,744 $(2,298) $(7,912) $7,627
(a) Primarily consists of derivatives that are not designated as accounting hedges under SFAS No. 133 and instruments no longer considered financial derivatives under SFAS No. 133.