PNC Bank 2001 Annual Report Download - page 41
Download and view the complete annual report
Please find page 41 of the 2001 PNC Bank annual report below. You can navigate through the pages in the report by either clicking on the pages listed below, or by using the keyword search tool below to find specific information within the annual report.-
 1
1 -
2
-
3
-
4
-
5
-
6
-
7
-
8
-
9
-
10
-
11
-
12
-
13
-
14
-
15
-
16
-
17
-
18
-
19
-
20
-
21
-
22
-
23
-
24
-
25
-
26
-
27
-
28
-
29
-
30
-
 31
31 -
 32
32 -
 33
33 -
 34
34 -
 35
35 -
 36
36 -
 37
37 -
 38
38 -
 39
39 -
 40
40 -
 41
41 -
 42
42 -
 43
43 -
 44
44 -
 45
45 -
 46
46 -
 47
47 -
 48
48 -
 49
49 -
 50
50 -
 51
51 -
52
-
53
-
54
-
55
-
56
-
57
-
58
-
59
-
60
-
61
-
62
-
63
-
64
-
65
-
66
-
67
-
68
-
69
-
70
-
71
-
72
-
73
-
74
-
75
-
76
-
77
-
78
-
79
-
80
-
81
-
82
-
83
-
84
-
85
-
86
-
87
-
88
-
89
-
90
-
91
-
92
-
93
-
94
-
95
-
96
-
97
-
98
-
99
-
100
-
101
-
102
-
103
-
104
 |
 |

39
CONSOLIDATED STATEMENT OF
INCOME REVIEW
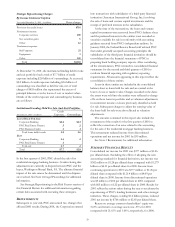
NET INTEREST INCOME
Changes in net interest income and margin result from the
interaction between the volume and composition of
earning assets, related yields and associated funding costs.
Accordingly, portfolio size, composition and yields earned
and funding costs can have a significant impact on net
interest income and margin.
Taxable-equivalent net interest income of $2.278 billion
for 2001 increased 4% compared with 2000. The increase
was primarily due to the impact of transaction deposit
growth and a lower rate environment that was partially
offset by the impact of continued downsizing of the loan
portfolio. The net interest margin widened 20 basis points
to 3.84% for 2001 compared with 3.64% for 2000. The
increase was primarily due to the impact of the lower rate
environment, the benefit of growth in transaction deposits
and downsizing of higher-cost, less valuable retail
certificates and wholesale deposits. See Interest Rate Risk in
the Risk Management section of this Financial Review for
additional information regarding interest rate risk.
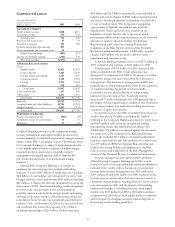
Loans represented 76% of average interest-earning
assets for 2001 compared with 84% for 2000. The decrease
was primarily due to the continued downsizing of certain
institutional lending portfolios and the securitization of
residential mortgage loans during 2001.
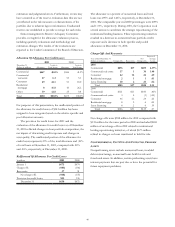
Net Interest Income Analysis
Average Balances Interest Income/Expense Average Yields/Rates
Taxable-equivalent basis
Year ended December 31
Dollars in millions 2001 2000 Change 2001 2000 Change 2001 2000 Change
Interest-earning assets
Loans held for sale $2,021 $2,507 $(486) $119 $204 $(85) 5.89% 8.14% (225)b
p
Securities 10,867 6,061 4,806 627 389 238 5.77 6.42 (65)
Loans, net of unearned income
Commercia
l
19,658 21,685 (2,027) 1,418 1,839 (421) 7.21 8.48 (127)
Commercial real estate 2,580 2,685 (105) 184 240 (56) 7.13 8.94 (181)
Consumer 9,099 9,177
(
78
)
732 791
(
59
)
8.04 8.62
(
58
)
Residential mort
g
a
g
e8,801 12,599 (3,798) 635 900 (265) 7.22 7.14 8
Lease financing 4,223 3,222 1,001 293 235 58 6.94 7.29 (35)
Other 460 650
(
190
)
30 55
(
25
)
6.52 8.46
(
194
)
Total loans, net of unearned
income 44,821 50,018 (5,197) 3,292 4,060 (768) 7.34 8.12 (78)
Other 1,632 1,289 343 115 97 18 7.05 7.53 (48)
Total interest-earning assets/
interest income 59,341 59,875 (534) 4,153 4,750 (597) 7.00 7.93 (93)
Noninterest-earning assets 11,014 8,616 2,398
Investment in discontinued
operations 51 487 (436)
Total assets $70,406 $68,978 $1,428
Interest-bearing liabilities
Deposits
Demand and mone
y
marke
t
$21,322 $18,735 $2,587 506 658
(
152
)
2.37 3.51
(
114
)
Savin
g
s1,928 2,050 (122) 18 36 (18) .93 1.76 (83)
Retail certificates of deposit 12,313 14,642 (2,329) 634 826 (192) 5.15 5.64 (49)
Other time 522 621
(
99
)
34 40
(
6
)
6.51 6.44 7
De
p
osits in forei
g
n offices 829 1,473 (644) 37 93 (56) 4.46 6.31 (185)
Total interest-bearing
deposits 36,914 37,521 (607) 1,229 1,653 (424) 3.33 4.41 (108)
Borrowed funds 13,482 13,746 (264) 646 915 (269) 4.79 6.66 (187)
Total interest-bearing liabilities/
interest expense 50,396 51,267 (871) 1,875 2,568 (693) 3.72 5.01 (129)
Noninterest-bearing liabilities,
minority interest, capital securities
and shareholders’ equity 20,010 17,711 2,299
Total liabilities, minority interest,
capital securities and
shareholders’ equity $70,406 $68,978 $1,428
Interest rate spread 3.28 2.92 36
Impact of noninterest-bearing sources .56 .72 (16)
Net interest income/margin $2,278 $2,182 $96 3.84% 3.64% 20bp