PNC Bank 2001 Annual Report Download - page 96
Download and view the complete annual report
Please find page 96 of the 2001 PNC Bank annual report below. You can navigate through the pages in the report by either clicking on the pages listed below, or by using the keyword search tool below to find specific information within the annual report.-
 1
1 -
2
-
3
-
4
-
5
-
6
-
7
-
8
-
9
-
10
-
11
-
12
-
13
-
14
-
15
-
16
-
17
-
18
-
19
-
20
-
21
-
22
-
23
-
24
-
25
-
26
-
27
-
28
-
29
-
30
-
31
-
32
-
33
-
34
-
35
-
36
-
37
-
38
-
39
-
40
-
41
-
42
-
43
-
44
-
45
-
46
-
47
-
48
-
49
-
50
-
51
-
52
-
53
-
54
-
55
-
56
-
57
-
58
-
59
-
60
-
61
-
62
-
63
-
64
-
65
-
66
-
67
-
68
-
69
-
70
-
71
-
72
-
73
-
74
-
75
-
76
-
77
-
78
-
79
-
80
-
81
-
82
-
83
-
84
-
85
-
 86
86 -
 87
87 -
 88
88 -
 89
89 -
 90
90 -
 91
91 -
 92
92 -
 93
93 -
 94
94 -
 95
95 -
 96
96 -
 97
97 -
 98
98 -
 99
99 -
 100
100 -
 101
101 -
 102
102 -
 103
103 -
 104
104
 |
 |

STATISTICAL INFORMATION
THE PNC FINANCIAL SERVICES GROUP, INC.
94
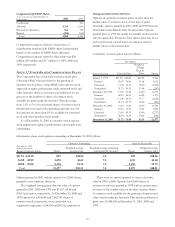
PNC restated its consolidated financial statements for the
first, second and third quarters of 2001 and revised
previously announced results for the fourth quarter of
2001. These restatements were made to reflect the
correction of an error related to the accounting for the sale
of the residential mortgage banking business in the first
quarter and to consolidate certain subsidiaries of a third
party financial institution in the second, third and fourth
quarters. See Note 3 Restatements for additional
information.
The error correction reduced income from
discontinued operations and net income by $35 million for
the first quarter of 2001. Diluted earnings per share was
reduced by $.12.
The consolidation of the third party subsidiaries
reduced third quarter net income by $51 million and
diluted earnings per share by $.18 and fourth quarter
results by $104 million and $.37, respectively
In consolidation, all loan assets of the third party
subsidiaries are included in loans held for sale. At the date
of sale, the difference between the sale price and carrying
value was recorded as charge-offs for portfolio loans and
as valuation adjustments in noninterest income for loans
previously held for sale. Subsequent to the date of sale,
lower of cost or market adjustments have been recorded
through charges to noninterest income.
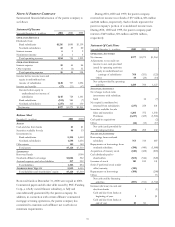
The following table summarizes the charges related to
the assets in these entities for 2001.
Charges Related To Third Party Subsidiaries
Year ended
December 31, 2001
In millions
Fourth
Quarter
Third
Quarter
Second
Quarter Total
At time of sale:
Charge-offs $9 $15 $24
Valuation adjustments 3 1 4
12 16 28
Valuation adjustments
subsequent to sale $158 82 240
Total $158 $94 $16 $268
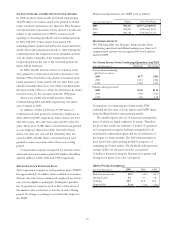
Venture capital assets in one of the third party subsidiaries
were carried at estimated fair value and additional valuation
adjustments of $7 million were recorded in the fourth
quarter of 2001.
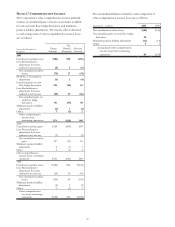
SELECTED QUARTERLY FINANCIAL DATA
2001 2000
Dollars in millions,
except per share data Fourth Third Second First Fourth Third Second First
SUMMARY OF OPERATIONS
Interest income $902 $984 $1,079 $1,172 $1,190 $1,201 $1,180 $1,161
Interest expense 324 419 514 618 657 670 635 606
Net interest income 578 565 565 554 533 531 545 555
Provision for credit losses 668 110 45 80 40 30 35 31
Noninterest income before net
securities (losses) gains 418 619 703 672 719 693 728 731
Net securities (losses) gains (3) 88 17 29 16 7 (3)
Noninterest expense 987 787 789 775 752 747 780 792
(Loss) income from continuing
operations before income taxes (662) 375 451 400 476 454 458 460
Income taxes (232) 128 156 135 162 155 159 158
(Loss) income from continuing
operations (430) 247 295 265 314 299 299 302
Income from discontinued operations 520 23 16 6
Net (loss) income before cumulative
effect of
accounting change (430) 247 295 270 334 322 315 308
Cumulative effect of accounting change (5)
Net (loss) income $(430) $247 $295 $265 $334 $322 $315 $308
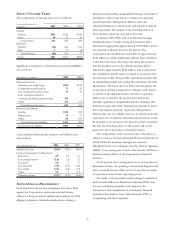
PER COMMON SHARE DATA
Book value $20.54 $23.09 $22.60 $22.39 $21.88 $21.01 $20.22 $19.68
Basic earnings (a)
Continuing operations (1.52) .85 1.01 .90 1.07 1.02 1.01 1.02
Discontinued operations .02 .07 .08 .06 .02
Before cumulative effect of
accounting change (1.52) .85 1.01 .92 1.14 1.10 1.07 1.04
Cumulative effect of accounting
change (.02)
Net income (1.52) .85 1.01 .90 1.14 1.10 1.07 1.04
Diluted earnings (a) (b)
Continuing operations (1.52) .84 1.00 .89 1.06 1.01 1.01 1.01
Discontinued operations .02 .07 .08 .05 .02
Before cumulative effect of
accounting change (1.52) .84 1.00 .91 1.13 1.09 1.06 1.03
Cumulative effect of accounting
change (.02)
Net income (1.52) .84 1.00 .89 1.13 1.09 1.06 1.03
(a) The sum of the quarterly amounts in 2001 does not equal the year’s amount because the quarterly calculations are based on a changing number of average shares.
(b) Additional shares were excluded from fourth quarter 2001 EPS calculations since they were antidilutive.