PNC Bank 2001 Annual Report Download - page 33
Download and view the complete annual report
Please find page 33 of the 2001 PNC Bank annual report below. You can navigate through the pages in the report by either clicking on the pages listed below, or by using the keyword search tool below to find specific information within the annual report.-
 1
1 -
2
-
3
-
4
-
5
-
6
-
7
-
8
-
9
-
10
-
11
-
12
-
13
-
14
-
15
-
16
-
17
-
18
-
19
-
20
-
21
-
22
-
 23
23 -
 24
24 -
 25
25 -
 26
26 -
 27
27 -
 28
28 -
 29
29 -
 30
30 -
 31
31 -
 32
32 -
 33
33 -
 34
34 -
 35
35 -
 36
36 -
 37
37 -
 38
38 -
 39
39 -
 40
40 -
 41
41 -
 42
42 -
 43
43 -
44
-
45
-
46
-
47
-
48
-
49
-
50
-
51
-
52
-
53
-
54
-
55
-
56
-
57
-
58
-
59
-
60
-
61
-
62
-
63
-
64
-
65
-
66
-
67
-
68
-
69
-
70
-
71
-
72
-
73
-
74
-
75
-
76
-
77
-
78
-
79
-
80
-
81
-
82
-
83
-
84
-
85
-
86
-
87
-
88
-
89
-
90
-
91
-
92
-
93
-
94
-
95
-
96
-
97
-
98
-
99
-
100
-
101
-
102
-
103
-
104
 |
 |

31
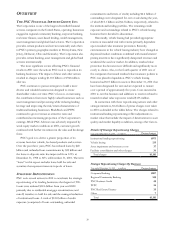
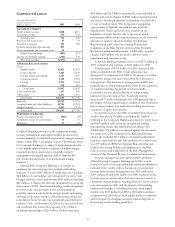
REVIEW OF BUSINESSES
PNC operates seven major businesses engaged in regional
community banking, corporate banking, real estate finance,
asset-based lending, wealth management, asset management
and global fund services.
Results of individual businesses are presented based on
PNC’s management accounting practices and the
Corporation’s management structure. There is no
comprehensive, authoritative body of guidance for
management accounting equivalent to generally accepted
accounting principles; therefore, the financial results of
individual businesses are not necessarily comparable with
similar information for any other financial services
institution. Financial results are presented, to the extent
practicable, as if each business operated on a stand-alone
basis.
The management accounting process uses various
balance sheet and income statement assignments and
transfers to measure performance of the businesses.
Methodologies change from time to time as management
accounting practices are enhanced and businesses change.
Securities available for sale or borrowings and related net
interest income are assigned based on the net asset or liability
position of each business. Capital is assigned based on
management’s assessment of inherent risks and equity levels
at independent companies providing similar products and
services. The allowance for credit losses is allocated based on
management’s assessment of risk inherent in the loan
portfolios. Support areas not directly aligned with the
businesses are allocated primarily based on the utilization of
services.
Total business financial results differ from consolidated
results from continuing operations primarily due to
differences between management accounting practices and
generally accepted accounting principles, equity management
activities, minority interest in income of consolidated entities,
residual asset and liability management activities, unallocated
reserves, eliminations and unassigned items, the impact of
which is reflected in the “Other” category. Details of inter-
segment revenues are included in Note 26 Segment
Reporting. The operating results and financial impact of the
disposition of the residential mortgage banking business,
previously PNC Mortgage, are included in discontinued
operations.
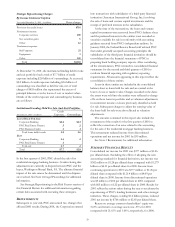
The impact of the institutional lending repositioning and
other strategic actions that occurred during 2001 is reflected
in the business results presented in the table below. The
charges are separately identified in the business income
statements. Performance ratios in the results of individual
businesses reflect the impact of the charges.
Results Of Businesses
Return on
Earnin
g
s (Net Loss) Revenue (a) Assi
g
ned Ca
p
ita
l
Avera
g
e Assets
Year ended December 31 - dollars in millions 2001 2000 2001 2000 2001 2000 2001 2000
Banking Businesses
Re
g
ional Community Bankin
g
$596 $590 $2,231 $2,033 22% 22% $40,285 $38,958
Cor
p
orate Bankin
g
(375) 241 764 84
4
(30) 18 16,685 17,746
PNC Real Estate Finance 38 8
4
213 229 10 21 5,290 5,889
PNC Business Credi
t
22 49 134 119 13 32 2,463 2,271
T
otal bankin
g
businesses 281 96
4
3,342 3,225 621 64,723 64,86
4
Asset Mana
g
ement and Processin
g
PNC Advisors 143 173 735 792 26 32 3,330 3,500
BlackRock 107 87 533 477 25 27 684 537
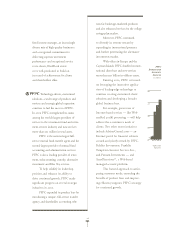
PFPC 36 47 738 67
4
17 22 1,771 1,578
T
otal asset mana
g
ement and
p
rocessin
g
286 307 2,006 1,943 24 28 5,785 5,615
T
otal business results 567 1,271 5,348 5,168 10 23 70,508 70,479
Other (190) (57) (527) (95) (153) (1,988)
Results from continuin
g
o
p
erations 377 1,21
4
4,821 5,073 621 70,355 68,491
Discontinued o
p
erations 565 51 487
Results before cumulative effect of
accounting change 382 1,279 4,821 5,073 622 70,406 68,978
Cumulative effect of accounting change (5)
Total consolidated - as reported $377 $1,279 $4,821 $5,073 622 $70,406 $68,978
(a) Business revenues are presented on a taxable-equivalent basis except for BlackRock and PFPC.