PNC Bank 2001 Annual Report Download - page 30
Download and view the complete annual report
Please find page 30 of the 2001 PNC Bank annual report below. You can navigate through the pages in the report by either clicking on the pages listed below, or by using the keyword search tool below to find specific information within the annual report.-
 1
1 -
2
-
3
-
4
-
5
-
6
-
7
-
8
-
9
-
10
-
11
-
12
-
13
-
14
-
15
-
16
-
17
-
18
-
19
-
 20
20 -
 21
21 -
 22
22 -
 23
23 -
 24
24 -
 25
25 -
 26
26 -
 27
27 -
 28
28 -
 29
29 -
 30
30 -
 31
31 -
 32
32 -
 33
33 -
 34
34 -
 35
35 -
 36
36 -
 37
37 -
 38
38 -
 39
39 -
 40
40 -
41
-
42
-
43
-
44
-
45
-
46
-
47
-
48
-
49
-
50
-
51
-
52
-
53
-
54
-
55
-
56
-
57
-
58
-
59
-
60
-
61
-
62
-
63
-
64
-
65
-
66
-
67
-
68
-
69
-
70
-
71
-
72
-
73
-
74
-
75
-
76
-
77
-
78
-
79
-
80
-
81
-
82
-
83
-
84
-
85
-
86
-
87
-
88
-
89
-
90
-
91
-
92
-
93
-
94
-
95
-
96
-
97
-
98
-
99
-
100
-
101
-
102
-
103
-
104
 |
 |

28
OVERVIEW
THE PNC FINANCIAL SERVICES GROUP, INC.
The Corporation is one of the largest diversified financial
services companies in the United States, operating businesses
engaged in regional community banking, corporate banking,
real estate finance, asset-based lending, wealth management,
asset management and global fund services. The Corporation
provides certain products and services nationally and others
in PNC’s primary geographic markets in Pennsylvania, New
Jersey, Delaware, Ohio and Kentucky. The Corporation also
provides certain banking, asset management and global fund
services internationally.
The most significant events affecting PNC’s financial
results in 2001 were the actions PNC took to reposition its
banking businesses. The impact of these and other actions
resulted in charges totaling $1.181 billion or $768 million
after tax.
PNC continues to pursue strategies to build a more
diverse and valuable business mix designed to create
shareholder value over time. PNC’s focus is on increasing
the contribution from more highly-valued businesses such as
asset management and processing while reducing lending
leverage and improving the risk/return characteristics of
traditional banking businesses. BlackRock and PFPC
continued to grow revenues at attractive rates and
contributed an increasing proportion of the Corporation’s
earnings. While PNC Advisors was adversely impacted by
weak equity market conditions in 2001, customer growth
continued with further investment in the sales and brokerage
force.
PNC’s goal is to derive a greater proportion of its
revenue from less volatile, fee-based products and services.
Over the past three years, PNC has reduced loans by $20
billion and unfunded loan commitments by $25 billion and
the loans to deposits ratio has improved from 121% at
December 31, 1998 to 80% at December 31, 2001. The term
“loans” in this report excludes loans held for sale and
securities that represent interests in pools of loans.
STRATEGIC REPOSITIONING
PNC took several actions in 2001 to accelerate the strategic
repositioning of its lending businesses that began in 1998.
Loans were reduced $12.6 billion from year end 2000
primarily due to residential mortgage securitizations and
runoff, transfers to held for sale and the managed reduction
of institutional loans. A total of $12.0 billion of credit
exposure (comprised of loans outstanding, unfunded
commitments and letters of credit) including $6.2 billion of
outstandings were designated for exit or sale during the year,
of which $10.1 billion and $4.3 billion, respectively, related to
the institutional lending portfolio. The remaining credit
exposure and outstandings related to PNC’s vehicle leasing
business that it decided to discontinue.
Historically, vehicle leasing had provided appropriate
returns at reasonable risk with returns primarily dependent
upon residual value insurance protection. Recently,
circumstances in the vehicle leasing industry have changed as
depressed market conditions combined with manufacturers’
pricing incentives have significantly dampened revenues and
weakened the used car market. In addition, residual value
protection has become more difficult and significantly more
costly to obtain. Also, in the fourth quarter of 2001 one of
the companies that issued residual value insurance policies to
PNC was placed in liquidation. PNC’s vehicle leasing
business had $1.9 billion in assets at December 31, 2001 that
have been designated for exit and are expected to mature
over a period of approximately five years. Costs incurred in
2001 to exit this business and additions to reserves related to
insured residual value exposures totaled $135 million.
In connection with these repositioning actions and other
strategic initiatives, $1.2 billion of pretax charges were taken
in 2001 as detailed in the tables below. The charges related to
institutional lending repositioning reflect adjustments to
market value that include the impact of deterioration in asset
quality and market liquidity conditions, among other factors.
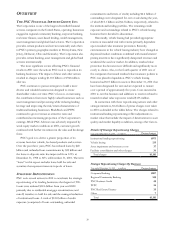
Details Of Strategic Repositioning Charges
Year ended December 31, 2001 - in millions Pretax charges
Institutional lending repositioning $973
Vehicle leasing 135
Asset impairment and severance costs 37
Facilities consolidation and other charges 36
Total charges $1,181
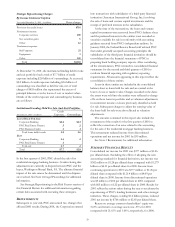
Strategic Repositioning Charges By Business
Year ended December 31, 2001 - in millions Pretax charges
Corporate Banking $907
Regional Community Banking 148
PNC Business Credit 48
PFPC 36
PNC Real Estate Finance 35
Other 7
Total $1,181