PNC Bank 2001 Annual Report Download - page 36
Download and view the complete annual report
Please find page 36 of the 2001 PNC Bank annual report below. You can navigate through the pages in the report by either clicking on the pages listed below, or by using the keyword search tool below to find specific information within the annual report.-
 1
1 -
2
-
3
-
4
-
5
-
6
-
7
-
8
-
9
-
10
-
11
-
12
-
13
-
14
-
15
-
16
-
17
-
18
-
19
-
20
-
21
-
22
-
23
-
24
-
25
-
 26
26 -
 27
27 -
 28
28 -
 29
29 -
 30
30 -
 31
31 -
 32
32 -
 33
33 -
 34
34 -
 35
35 -
 36
36 -
 37
37 -
 38
38 -
 39
39 -
 40
40 -
 41
41 -
 42
42 -
 43
43 -
 44
44 -
 45
45 -
 46
46 -
47
-
48
-
49
-
50
-
51
-
52
-
53
-
54
-
55
-
56
-
57
-
58
-
59
-
60
-
61
-
62
-
63
-
64
-
65
-
66
-
67
-
68
-
69
-
70
-
71
-
72
-
73
-
74
-
75
-
76
-
77
-
78
-
79
-
80
-
81
-
82
-
83
-
84
-
85
-
86
-
87
-
88
-
89
-
90
-
91
-
92
-
93
-
94
-
95
-
96
-
97
-
98
-
99
-
100
-
101
-
102
-
103
-
104
 |
 |

34
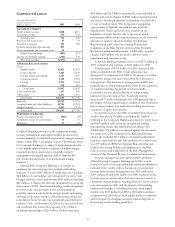
PNC REAL ESTATE FINANCE
Year ended December 31
Taxable-equivalent basis
Dollars in millions 2001 2000
INCOME STATEMENT
Net interest income $118 $121
Noninterest income
Commercial mortgage banking 58 68
Other 37 40
Total noninterest income 95 108
Total revenue 213 229
Provision for credit losses 16 (7)
Noninterest expense 157 145
Institutional lending repositioning 34
Severance costs 1
Pretax earnings 591
Income tax (benefit) ex
p
ense (33) 7
Earnin
g
s$38 $84
AVERAGE BALANCE
S
HEET
Loans
Commercial real estate $2,337 $2,427
Commercial – real estate related 1,751 2,118
Total loans 4,088 4,545
Commercial mortgages held for sale 279 396
Other assets 923 948
Total assets $5,290 $5,889
De
p
osits $518 $697
Assi
g
ned funds and other liabilities 4,375 4,784
Assi
g
ned ca
p
ita
l
397 408
T
otal funds $5,290 $5,889
P
ERFORMANCE
R
ATIO
S
Return on assi
g
ned ca
p
ita
l
10% 21%
Noninterest income to total revenue 43 47
Efficienc
y
60 51
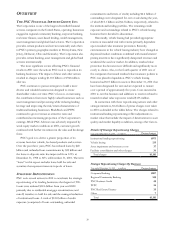
PNC Real Estate Finance provides credit, capital markets,
treasury management, commercial mortgage loan servicing
and other financial products and services to developers,
owners and investors in commercial real estate. PNC’s
commercial real estate financial services platform provides
processing services through Midland Loan Services, Inc., a
leading third-party provider of loan servicing and technology
to the commercial real estate finance industry, and national
syndication of affordable housing equity through Columbia
Housing Partners, LP (“Columbia”).
On October 17, 2001, PNC completed the acquisition of
certain lending and servicing-related business from TRI
Acceptance Corporation. The acquisition expands PNC Real
Estate Finance’s reach in multi-family finance, combining
permanent loan capacity with PNC’s traditional interim
lending activities and Columbia’s tax credit syndication
capabilities.
Over the past three years, PNC Real Estate Finance has
been strategically shifting to a more balanced and valuable
revenue stream by focusing on real estate processing
businesses and increasing the value of its lending business by
seeking to sell more fee-based products.
During 2001, PNC Real Estate Finance took actions to
accelerate the downsizing of its institutional lending business.
A total of $400 million of credit exposure including $250
million of outstandings were designated for exit or held for
sale. Charges related to these actions were $34 million. At
December 31, 2001, $324 million of credit exposure
including $244 million of outstandings were classified as held
for sale, net of charges of $34 million that represented the
excess of principal balances outstanding over the lower of
cost or market values. See Strategic Repositioning and
Critical Accounting Policies and Judgments in the Risk
Factors section of this Financial Review for additional
information. A $1 million pretax charge for severance costs
was incurred in 2001.
PNC Real Estate Finance earned $38 million in 2001
compared with $84 million in 2000.
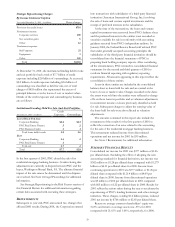
Total revenue was $213 million for 2001 compared with
$229 million for 2000. The decrease was primarily due to
higher amortization of servicing intangibles caused by lower
interest rates and lower commercial mortgage-backed
securitization gains. The commercial mortgage servicing
portfolio increased 26% to $68 billion at December 31, 2001
as shown below:
Commercial Mortgage Servicing Portfolio
In billions 2001 2000
January 1 $54 $45
Acquisitions/additions 25 17
Repayments/transfers (11) (8)
December 31 $68 $54
Total credit costs in the 2001 consolidated provision for
credit losses were $44 million, including $16 million reflected
in the PNC Real Estate Finance provision for credit losses
and $28 million reflected in the institutional lending
repositioning charge that represented net charge-offs.
Additionally, $14 million was charged against the allowance
for credit losses. The institutional lending repositioning
charge also included $6 million of valuation adjustments
related to loans held for sale. The provision for 2000
reflected a net recovery of $7 million. See Critical
Accounting Policies and Judgments in the Risk Factors
section and Credit Risk in the Risk Management section of
this Financial Review for additional information.
Noninterest expense was $157 million for 2001
compared with $145 million in the prior year. The increase
was primarily due to non-cash (passive) losses on affordable
housing investments that were more than offset by related
income tax credits.