PNC Bank 2001 Annual Report Download - page 77
Download and view the complete annual report
Please find page 77 of the 2001 PNC Bank annual report below. You can navigate through the pages in the report by either clicking on the pages listed below, or by using the keyword search tool below to find specific information within the annual report.-
 1
1 -
2
-
3
-
4
-
5
-
6
-
7
-
8
-
9
-
10
-
11
-
12
-
13
-
14
-
15
-
16
-
17
-
18
-
19
-
20
-
21
-
22
-
23
-
24
-
25
-
26
-
27
-
28
-
29
-
30
-
31
-
32
-
33
-
34
-
35
-
36
-
37
-
38
-
39
-
40
-
41
-
42
-
43
-
44
-
45
-
46
-
47
-
48
-
49
-
50
-
51
-
52
-
53
-
54
-
55
-
56
-
57
-
58
-
59
-
60
-
61
-
62
-
63
-
64
-
65
-
66
-
 67
67 -
 68
68 -
 69
69 -
 70
70 -
 71
71 -
 72
72 -
 73
73 -
 74
74 -
 75
75 -
 76
76 -
 77
77 -
 78
78 -
 79
79 -
 80
80 -
 81
81 -
 82
82 -
 83
83 -
 84
84 -
 85
85 -
 86
86 -
 87
87 -
88
-
89
-
90
-
91
-
92
-
93
-
94
-
95
-
96
-
97
-
98
-
99
-
100
-
101
-
102
-
103
-
104
 |
 |

75
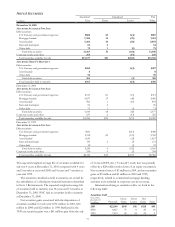
The carrying value of securities pledged to secure public and
trust deposits and repurchase agreements and for other
purposes was $6.2 billion and $3.8 billion at December 31,
2001 and December 31, 2000, respectively. The fair value of
securities accepted as collateral that the Corporation is
permitted by contract or custom to sell or repledge was $260
million at December 31, 2001, of which $160 million was
repledged to others.
The following table presents the amortized cost, fair value and weighted-average yield of debt securities at December 31,
2001, by remaining contractual maturity.
Contractual Maturity Of Debt Securities
December 31, 2001 Within 1 to 5 to After 10
Dollars in millions 1 Year 5 Years 10 Years Years Total
SECURITIES AVAILABLE FOR SALE
U.S. Treasury and government agencies $95 $591 $116 $6 $808
Mortgage-backed 29 11 7,262 7,302
Asset-backed 2,309 1,010 1,847 5,166
State and municipal 21538 762
Other debt 33027 1575
Total securities available for sale $100 $2,974 $1,202 $9,137 $13,413
Fair value
$
100
$
2
,
958
$
1
,
183
$
9
,
059
$
13
,
300
Wei
g
hted-avera
g
e yield 1.93% 3.65% 5.35% 5.80
%
5.26%
S
ECURITIES HELD TO
M
A
TURIT
Y
U.S. Treasury and
g
overnment a
g
encies $260 $260
A
sset-backed $8 8
Other deb
t
$66 23 $6 95
T
otal securities held to maturit
y
$66 $31 $6 $260 $363
Fair value $66 $31 $6 $257 $360
Wei
g
hted-avera
g
e yield 2.04% 2.30% 5.88% 5.80
%
4.82%
Based on current interest rates and expected prepayment speeds, the total weighted-average expected maturity of mortgage-
backed securities was 4 years and asset-backed securities was 4 years and 2 months at December 31, 2001. Weighted-average
yields are based on historical cost with effective yields weighted for the contractual maturity of each security.
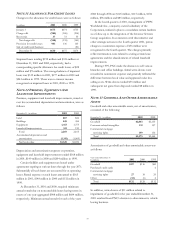
NOTE 9 LOANS AND COMMITMENTS TO EXTEND CREDIT
Loans outstanding were as follows:
December 31 - in millions 2001 2000 1999 1998 1997
Commercial $15,205 $21,207 $21,468 $25,177 $19,988
Commercial real estate 2,372 2,583 2,730 3,449 3,974
Consumer 9,164 9,133 9,348 10,980 11,205
Residential mortgage 6,395 13,264 12,506 12,253 12,776
Lease financing 5,557 4,845 3,663 2,978 2,224
Credit card 2,958 3,830
Other 445 568 682 392 650
T
otal loans 39,138 51,600 50,397 58,187 54,647
Unearned income (1,164) (999) (724) (554) (412)
Total loans, net of unearned income $37,974 $50,601 $49,673 $57,633 $54,235
Loans outstanding and related unfunded commitments are concentrated in PNC’s primary geographic markets. At December
31, 2001, no specific industry concentration exceeded 8.3% of total commercial loans outstanding and unfunded commitments.