PNC Bank 2001 Annual Report Download - page 50
Download and view the complete annual report
Please find page 50 of the 2001 PNC Bank annual report below. You can navigate through the pages in the report by either clicking on the pages listed below, or by using the keyword search tool below to find specific information within the annual report.-
 1
1 -
2
-
3
-
4
-
5
-
6
-
7
-
8
-
9
-
10
-
11
-
12
-
13
-
14
-
15
-
16
-
17
-
18
-
19
-
20
-
21
-
22
-
23
-
24
-
25
-
26
-
27
-
28
-
29
-
30
-
31
-
32
-
33
-
34
-
35
-
36
-
37
-
38
-
39
-
 40
40 -
 41
41 -
 42
42 -
 43
43 -
 44
44 -
 45
45 -
 46
46 -
 47
47 -
 48
48 -
 49
49 -
 50
50 -
 51
51 -
 52
52 -
 53
53 -
 54
54 -
 55
55 -
 56
56 -
 57
57 -
 58
58 -
 59
59 -
 60
60 -
61
-
62
-
63
-
64
-
65
-
66
-
67
-
68
-
69
-
70
-
71
-
72
-
73
-
74
-
75
-
76
-
77
-
78
-
79
-
80
-
81
-
82
-
83
-
84
-
85
-
86
-
87
-
88
-
89
-
90
-
91
-
92
-
93
-
94
-
95
-
96
-
97
-
98
-
99
-
100
-
101
-
102
-
103
-
104
 |
 |

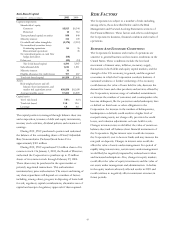
48
estimation and judgmental errors. Furthermore, events may
have occurred as of the reserve evaluation date that are not
yet reflected in the risk measures or characteristics of the
portfolio due to inherent lags in information. Unallocated
reserves are established to provide coverage for such risks.
Senior management’s Reserve Adequacy Committee
provides oversight for the allowance evaluation process,
including quarterly evaluations and methodology and
estimation changes. The results of the evaluations are
reported to the Credit Committee of the Board of Directors.
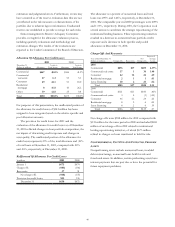
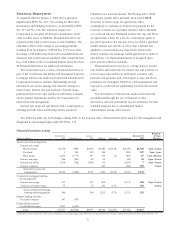
Allocation Of Allowance For Credit Losses
2001 2000
December 31
Dollars in millions Allowance
Loans to
Total Loans Allowance
Loans to
Total Loans
Commercial $467 40.0% $536 41.9
%
Commercial
real estate 67 6.3 53 5.1
Consumer 49 24.1 51 18.0
Residential
mortgage 816.8 10 26.2
Other 39 12.8 25 8.8
Total $630 100.0% $675 100.0
%
For purposes of this presentation, the unallocated portion of
the allowance for credit losses of $143 million has been
assigned to loan categories based on the relative specific and
pool allocation amounts.
The provision for credit losses for 2001 and the
evaluation of the allowance for credit losses as of December
31, 2001 reflected changes in loan portfolio composition, the
net impact of downsizing credit exposure and changes in
asset quality. The unallocated portion of the allowance for
credit losses represents 23% of the total allowance and .38%
of total loans at December 31, 2001, compared with 20%
and .26%, respectively, at December 31, 2000.
Rollforward Of Allowance For Credit Losses
In millions 2001 2000
January 1 $675 $674
Char
g
e-offs (985) (186)
Recoveries 37 51
Net char
g
e-offs (948) (135)
Provision for credit losses 903 136
December 31 $630 $675
The allowance as a percent of nonaccrual loans and total
loans was 299% and 1.66%, respectively, at December 31,
2001. The comparable year end 2000 percentages were 209%
and 1.33%, respectively. During 2001, the Corporation took
several actions to accelerate the strategic repositioning of the
institutional lending business. These repositioning initiatives
resulted in a decrease in commercial loan portfolio credit
exposure and a decrease in both specific and pooled
allowances at December 31, 2001.
Charge-Offs And Recoveries
Percent of
Year ended December 31 Net Average
Dollars in millions Charge-offs Recoveries Charge-offs Loans
2001
Commercial $876 $17 $859 4.37%
Commercial real estate 37 1 36 1.40
Consumer 42 16 26 .29
Residential mortgage 21 1.01
Lease financing 28 2 26 .62
Total $985 $37 $948 2.12
2000
Commercial $121 $21 $100 .46%
Commercial real estate 3 4 (1) (.04)
Consumer 46 22 24 .26
Residential mortgage 8 2 6 .05
Lease financing 8 2 6 .19
Total $186 $51 $135 .27
Net charge-offs were $948 million for 2001 compared with
$135 million for the same period in 2000 and included $804
million of net charge-offs in 2001 related to institutional
lending repositioning initiatives, of which $673 million
related to charges on loans transferred to held for sale.
NONPERFORMING, PAST DUE AND POTENTIAL PROBLEM
ASSETS
Nonperforming assets include nonaccrual loans, troubled
debt restructurings, nonaccrual loans held for sale and
foreclosed assets. In addition, certain performing assets have
interest payments that are past due or have the potential for
future repayment problems.