PNC Bank 2001 Annual Report Download - page 89
Download and view the complete annual report
Please find page 89 of the 2001 PNC Bank annual report below. You can navigate through the pages in the report by either clicking on the pages listed below, or by using the keyword search tool below to find specific information within the annual report.-
 1
1 -
2
-
3
-
4
-
5
-
6
-
7
-
8
-
9
-
10
-
11
-
12
-
13
-
14
-
15
-
16
-
17
-
18
-
19
-
20
-
21
-
22
-
23
-
24
-
25
-
26
-
27
-
28
-
29
-
30
-
31
-
32
-
33
-
34
-
35
-
36
-
37
-
38
-
39
-
40
-
41
-
42
-
43
-
44
-
45
-
46
-
47
-
48
-
49
-
50
-
51
-
52
-
53
-
54
-
55
-
56
-
57
-
58
-
59
-
60
-
61
-
62
-
63
-
64
-
65
-
66
-
67
-
68
-
69
-
70
-
71
-
72
-
73
-
74
-
75
-
76
-
77
-
78
-
 79
79 -
 80
80 -
 81
81 -
 82
82 -
 83
83 -
 84
84 -
 85
85 -
 86
86 -
 87
87 -
 88
88 -
 89
89 -
 90
90 -
 91
91 -
 92
92 -
 93
93 -
 94
94 -
 95
95 -
 96
96 -
 97
97 -
 98
98 -
 99
99 -
100
-
101
-
102
-
103
-
104
 |
 |

87
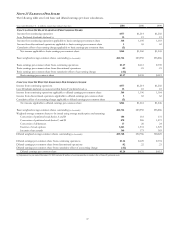
NOTE 25 EARNINGS PER SHARE
The following table sets forth basic and diluted earnings per share calculations.
Year ended December 31 - in millions, except share and per share data 2001 2000 1999
CALCULATION OF BASIC EARNINGS PER COMMON SHARE
Income from continuing operations $377 $1,214 $1,202
Less: Preferred dividends declared (a) 13 19 19
Income from continuing operations applicable to basic earnings per common share 364 1,195 1,183
Income from discontinued operations applicable to basic earnings per common share 565 62
Cumulative effect of accounting change applicable to basic earnings per common share (5)
Net income applicable to basic earnings per common share $364 $1,260 $1,245
Basic weighted-average common shares outstanding (in thousands) 286,726 289,958 296,886
Basic earnings per common share from continuing operations $1.27 $4.12 $3.98
Basic earnings per common share from discontinued operations .02 .23 .21
Basic earnings per common share from cumulative effect of accounting change (.02)
Basic earnings per common share $1.27 $4.35 $4.19
CALCULATION OF DILUTED EARNINGS PER COMMON SHARE
Income from continuing operations $377 $1,214 $1,202
Less: Dividends declared on nonconvertible Series F preferred stock (a) 13 18 18
Income from continuing operations applicable to diluted earnings per common share 364 1,196 1,184
Income from discontinued operations applicable to diluted earnings per common share 565 62
Cumulative effect of accounting change applicable to diluted earnings per common share (5)
Net income applicable to diluted earnings per common share $364 $1,261 $1,246
Basic weighted-average common shares outstanding (in thousands) 286,726 289,958 296,886
Weighted-average common shares to be issued using average market price and assuming:
Conversion of preferred stock Series A and B 106 118 131
Conversion of preferred stock Series C and D 870 986 1,072
Conversion of debentures 17 20 24
Exercise of stock options 1,661 1,531 1,529
Incentive share awards 368 173 383
Diluted weighted-average common shares outstanding (in thousands) 289,748 292,786 300,025
Diluted earnings per common share from continuing operations $1.26 $4.09 $3.94
Diluted earnings per common share from discontinued operations .02 .22 .21
Diluted earnings per common share from cumulative effect of accounting change (.02)
Diluted earnings per common share $1.26 $4.31 $4.15
(a) Adjustment for year ended December 31, 2001 includes $1 million of cost incurred due to tender offer of Series F preferred stock.