PNC Bank 2001 Annual Report Download - page 54
Download and view the complete annual report
Please find page 54 of the 2001 PNC Bank annual report below. You can navigate through the pages in the report by either clicking on the pages listed below, or by using the keyword search tool below to find specific information within the annual report.-
 1
1 -
2
-
3
-
4
-
5
-
6
-
7
-
8
-
9
-
10
-
11
-
12
-
13
-
14
-
15
-
16
-
17
-
18
-
19
-
20
-
21
-
22
-
23
-
24
-
25
-
26
-
27
-
28
-
29
-
30
-
31
-
32
-
33
-
34
-
35
-
36
-
37
-
38
-
39
-
40
-
41
-
42
-
43
-
 44
44 -
 45
45 -
 46
46 -
 47
47 -
 48
48 -
 49
49 -
 50
50 -
 51
51 -
 52
52 -
 53
53 -
 54
54 -
 55
55 -
 56
56 -
 57
57 -
 58
58 -
 59
59 -
 60
60 -
 61
61 -
 62
62 -
 63
63 -
 64
64 -
65
-
66
-
67
-
68
-
69
-
70
-
71
-
72
-
73
-
74
-
75
-
76
-
77
-
78
-
79
-
80
-
81
-
82
-
83
-
84
-
85
-
86
-
87
-
88
-
89
-
90
-
91
-
92
-
93
-
94
-
95
-
96
-
97
-
98
-
99
-
100
-
101
-
102
-
103
-
104
 |
 |

52
The principal source of parent company revenue and
cash flow is the dividends it receives from PNC Bank. The
bank’s dividend level may be impacted by its capital needs,
supervisory policies, corporate policies, contractual
restrictions and other factors. Also, there are legal limitations
on the ability of national banks to pay dividends or make
other capital distributions. PNC Bank was not permitted to
pay dividends to the parent company as of December 31,
2001 without prior approval from banking regulators as a
result of the repositioning charges taken in 2001 and prior
dividends. Under these limitations, PNC Bank’s capacity to
pay dividends without prior regulatory approval can be
restored through retention of earnings. Management expects
PNC Bank’s dividend capacity relative to such legal
limitations to be restored during 2002 from retained
earnings.
In addition to dividends from PNC Bank, other sources
of parent company liquidity include cash and short-term
investments, as well as dividends and loan repayments from
other subsidiaries. As of December 31, 2001, the parent
company had approximately $800 million in funds available
from its cash and short-term investments or other funds
available from unrestricted subsidiaries. Management
believes the parent company has sufficient liquidity available
from sources other than dividends from PNC Bank to meet
current obligations to its debt holders, vendors, and others
and to pay dividends at current rates through 2002.
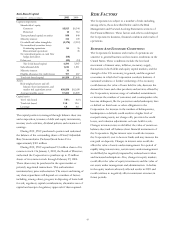
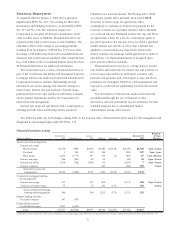
The following tables set forth contractual obligations and various commitments representing required and potential cash
outflows as of December 31, 2001.
Contractual Obligations Payment Due By Period
December 31, 2001 - in millions Total
Less than one
year
One to three
years
Four to five
years
After five
years
Minimum annual rentals on noncancellable leases $908 $125 $220 $181 $382
Remaining contractual maturities of time deposits 12,773 8,718 2,456 1,110 489
Borrowed funds 12,090 3,382 4,482 2,742 1,484
Capital securities of subsidiary trusts (a) 848 848
Total contractual cash obligations $26,619 $12,225 $7,158 $4,033 $3,203
(a) Reflects the maturity of junior subordinated debentures held by subsidiary trusts.
Other Commitments (a) Total Amount Of Commitment Expiration By Period
December 31, 2001 - in millions
Amounts
Committed
Less than one
year
One to three
years
Four to five
years
After five
years
Standby letters of credit $3,998 $2,102 $1,727 $156 $13
Loan commitments 25,279 15,507 6,632 2,808 332
Asset-backed commercial
p
a
p
er condui
t
5,764 5,713 51
Other commitments (b) 247 9 211 27
T
otal commitments $35,288 $23,331 $8,621 $2,991 $345
(a) Commitments are funding commitments that could potentially require performance in the event of demands by third parties or contingent events. Loan commitments are reported
net of participations, assignments and syndications.
(b) Equity Management funding commitments.
TRADING ACTIVITIES
Most of PNC’s trading activities are designed to provide
capital markets services to customers and not to position the
Corporation’s portfolio for gains from market movements.
Trading activities are confined to financial instruments and
financial derivatives. PNC participates in derivatives and
foreign exchange trading as well as underwriting and “market
making” in equity securities as an accommodation to
customers. PNC also engages in trading activities as part of
risk management strategies. Net trading income was $147
million in 2001 compared with $91 million in 2000. See Note
7 Trading Activities for additional information.
Risk associated with trading, capital markets and foreign
exchange activities is managed using a value-at-risk approach
that combines interest rate risk, foreign exchange rate risk,
spread risk and volatility risk. Using this approach, exposure
is measured as the potential loss due to a two standard
deviation, one-day move in interest rates. The estimated
average combined value-at-risk of all trading operations
using this measurement was $.7 million for both 2001 and
2000. The estimated combined period-end value-at-risk was
$.9 million at December 31, 2001 and $.5 million at
December 31, 2000.