PNC Bank 2001 Annual Report Download - page 75
Download and view the complete annual report
Please find page 75 of the 2001 PNC Bank annual report below. You can navigate through the pages in the report by either clicking on the pages listed below, or by using the keyword search tool below to find specific information within the annual report.-
 1
1 -
2
-
3
-
4
-
5
-
6
-
7
-
8
-
9
-
10
-
11
-
12
-
13
-
14
-
15
-
16
-
17
-
18
-
19
-
20
-
21
-
22
-
23
-
24
-
25
-
26
-
27
-
28
-
29
-
30
-
31
-
32
-
33
-
34
-
35
-
36
-
37
-
38
-
39
-
40
-
41
-
42
-
43
-
44
-
45
-
46
-
47
-
48
-
49
-
50
-
51
-
52
-
53
-
54
-
55
-
56
-
57
-
58
-
59
-
60
-
61
-
62
-
63
-
64
-
 65
65 -
 66
66 -
 67
67 -
 68
68 -
 69
69 -
 70
70 -
 71
71 -
 72
72 -
 73
73 -
 74
74 -
 75
75 -
 76
76 -
 77
77 -
 78
78 -
 79
79 -
 80
80 -
 81
81 -
 82
82 -
 83
83 -
 84
84 -
 85
85 -
86
-
87
-
88
-
89
-
90
-
91
-
92
-
93
-
94
-
95
-
96
-
97
-
98
-
99
-
100
-
101
-
102
-
103
-
104
 |
 |

73
The amounts contained in this report also include the
restatement of the results for the first quarter of 2001 to
reflect the correction of an error related to the accounting
for the sale of the residential mortgage banking business.
This restatement reduced income from discontinued
operations and net income for 2001 by $35 million.
NOTE 4 FOURTH QUARTER ACTIONS
In the fourth quarter of 2001, PNC took several actions to
accelerate the strategic repositioning of its lending businesses
that began in 1998. The Corporation decided to exit
approximately $7.9 billion of credit exposure including $3.1
billion of loan outstandings in the institutional lending
portfolios. Of these amounts, approximately $5.2 billion of
credit exposure and $2.9 billion of loans, respectively, have
been transferred to loans held for sale. The remaining
amounts have been designated for exit and are expected to
run off over the next several years. In connection with the
transfer to held for sale, $653 million of charge-offs and
valuation adjustments were recognized in the fourth quarter.
Additionally, $90 million in charge-offs were taken against
the allowance for credit losses specifically allocated to these
loans.
PNC also made the decision to discontinue its vehicle
leasing business due to continued depressed market
conditions and the increased difficulty and cost of obtaining
residual value insurance protection. The vehicle leasing
business had $1.9 billion in assets at December 31, 2001 that
have been designated for exit and will mature over a period
of approximately five years. Costs incurred in 2001 to exit
this business, including the impairment of goodwill
associated with a prior acquisition and employee severance
costs, and additions to reserves related to insured residual
value exposures totaled $135 million and were charged to
noninterest expense.
The Corporation also recorded charges of $65 million in
the fourth quarter for certain integration, severance and
other costs related to other strategic initiatives.
NOTE 5 SALE OF SUBSIDIARY STOCK
PNC recognizes as income the gain from the sale of stock by
its subsidiaries. The gain is the difference between PNC’s
basis in the stock and the proceeds per share received. PNC
provides applicable taxes on the gain.
In October 1999, BlackRock, Inc. (“BlackRock”), a
majority-owned investment management subsidiary of the
Corporation, issued nine million shares of class A common
stock at $14.00 per share in an initial public offering (“IPO”).
Prior to the IPO, PNC and BlackRock’s management owned
approximately 82% and 18%, respectively, of BlackRock’s
outstanding common stock. Proceeds from the sale were
approximately $115 million and resulted in PNC recording a
pretax gain in the amount of $64 million or $59 million after
tax. As of December 31, 2001, PNC owned approximately
70% of BlackRock.
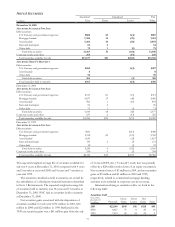
NOTE 6 CASH FLOWS
For the consolidated statement of cash flows, cash and cash
equivalents are defined as cash and due from banks.
The following table sets forth information pertaining to
acquisitions and divestitures that affected cash flows:
Cash Flows
Year ended December 31 - in millions 2001 2000 1999
Assets divested (acquired) $7,252 $(4) $2,062
Liabilities divested (ac
q
uired) 6,852 (4) 208
Cash
p
aid 18 31 1,407
Cash and due from banks received 503 1 3,261
NOTE 7 TRADING ACTIVITIES
Most of PNC’s trading activities are designed to provide
capital markets services to customers and not to position the
Corporation’s portfolio for gains from market movements.
PNC participates in derivatives and foreign exchange trading
as well as underwriting and “market making” in equity
securities as an accommodation to customers. PNC also
engages in trading activities as part of risk management
strategies.
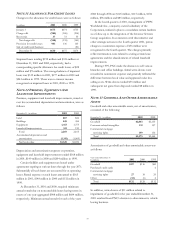
Net trading income in 2001, 2000 and 1999 included in
noninterest income was as follows:
Details Of Trading Activities
Year ended December 31 - in millions 2001 2000 1999
Corporate services $5 $7
Other noninterest income
Securities underwriting and
trading 55 42 $48
Derivatives trading 61 20 8
Foreign exchange 26 22 17
Net tradin
g
income $147 $91 $73