PNC Bank 2001 Annual Report Download - page 76
Download and view the complete annual report
Please find page 76 of the 2001 PNC Bank annual report below. You can navigate through the pages in the report by either clicking on the pages listed below, or by using the keyword search tool below to find specific information within the annual report.-
 1
1 -
2
-
3
-
4
-
5
-
6
-
7
-
8
-
9
-
10
-
11
-
12
-
13
-
14
-
15
-
16
-
17
-
18
-
19
-
20
-
21
-
22
-
23
-
24
-
25
-
26
-
27
-
28
-
29
-
30
-
31
-
32
-
33
-
34
-
35
-
36
-
37
-
38
-
39
-
40
-
41
-
42
-
43
-
44
-
45
-
46
-
47
-
48
-
49
-
50
-
51
-
52
-
53
-
54
-
55
-
56
-
57
-
58
-
59
-
60
-
61
-
62
-
63
-
64
-
65
-
 66
66 -
 67
67 -
 68
68 -
 69
69 -
 70
70 -
 71
71 -
 72
72 -
 73
73 -
 74
74 -
 75
75 -
 76
76 -
 77
77 -
 78
78 -
 79
79 -
 80
80 -
 81
81 -
 82
82 -
 83
83 -
 84
84 -
 85
85 -
 86
86 -
87
-
88
-
89
-
90
-
91
-
92
-
93
-
94
-
95
-
96
-
97
-
98
-
99
-
100
-
101
-
102
-
103
-
104
 |
 |

74
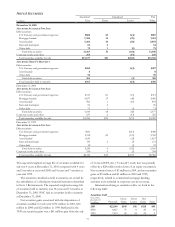
NOTE 8 SECURITIES
Amortized Unrealized Fair
In millions Cost Gains Losses Value
December 31, 2001
S
ECURITIES
A
VAILABLE
F
OR
S
A
L
E
Debt securities
U.S. Treasury and government agencies $808 $3 $(4) $807
Mortgage-backed 7,302 35 (76) 7,261
Asset-backed 5
,
166 10
(
83
)
5
,
093
State and municipal 62 2 64
Other deb
t
75 1
(
1
)
75
T
otal debt securities 13
,
413 51
(
164
)
13
,
300
Cor
p
orate stocks and other 264
(
19
)
245
Total securities available for sale $13,677 $51 $(183) $13,545
SECURITIES HELD TO MATURITY
Debt securities
U.S. Treasury and government agencies $260 $(3) $257
Asset-backed 88
Other deb
t
95 95
Total debt securities 363 (3) 360
Total securities held to maturity $363 $(3) $360
December 31
,
2000
S
ECURITIES
A
VAILABLE
F
OR
S
A
L
E
Debt securities
U.S. Treasury and government agencies $313 $1 $(1) $313
Mortgage-backed 4,037 13 (48) 4,002
Asset-backed 902 1
(
10
)
893
State and municipal 94 2 96
Other deb
t
73 1
(
1
)
73
T
otal debt securities 5
,
419 18
(
60
)
5
,
377
Corporate stocks and other 537 2 (14) 525
Total securities available for sale $5,956 $20 $(74) $5,902
December 31
,
1999
SECURITIES AVAILABLE FOR SALE
Debt securities
U.S. Treasury and government agencies $411 $(11) $400
Mortgage-backed 3,918 $2 (151) 3,769
Asset-backed 1
,
051
(
24
)
1
,
027
State and municipal 134 2 (5) 131
Other deb
t
40
(
1
)
39
T
otal debt securities 5
,
554 4
(
192
)
5
,
366
Corporate stocks and other 590 9 (5) 594
T
otal securities available for sale $6,144 $13 $
(
197
)
$5,960
The expected weighted-average life of securities available for
sale was 4 years at December 31, 2001 compared with 4 years
and 5 months at year-end 2000 and 4 years and 7 months at
year-end 1999.
The securities classified as held to maturity are owned by
the subsidiaries of a third party financial institution described
in Note 3 Restatements. The expected weighted-average life
of securities held to maturity was 18 years and 11 months at
December 31, 2001. PNC had no securities held to maturity
at December 31, 2000.
Net securities gains associated with the disposition of
securities available for sale were $131 million in 2001, $20
million in 2000 and $22 million in 1999. Reflected in the
1999 net securities gains was a $41 million gain from the sale
of Concord EFS, Inc. (“Concord”) stock that was partially
offset by a $28 million write-down of an equity investment.
Net securities losses of $3 million in 2001 and net securities
gains of $9 million and $3 million in 2000 and 1999,
respectively, related to commercial mortgage banking
activities were included in corporate services revenue.
Information relating to securities sold is set forth in the
following table:
Securities Sold
Year ended
December 31
In millions Proceeds
Gross
Gains
Gross
Losses
Net
Gains Taxes
2001 $22,144 $144 $16 $128 $45
2000 8,427 37 8 29 10
1999 7,573 69 44 25 9