PNC Bank 2001 Annual Report Download - page 31
Download and view the complete annual report
Please find page 31 of the 2001 PNC Bank annual report below. You can navigate through the pages in the report by either clicking on the pages listed below, or by using the keyword search tool below to find specific information within the annual report.-
 1
1 -
2
-
3
-
4
-
5
-
6
-
7
-
8
-
9
-
10
-
11
-
12
-
13
-
14
-
15
-
16
-
17
-
18
-
19
-
20
-
 21
21 -
 22
22 -
 23
23 -
 24
24 -
 25
25 -
 26
26 -
 27
27 -
 28
28 -
 29
29 -
 30
30 -
 31
31 -
 32
32 -
 33
33 -
 34
34 -
 35
35 -
 36
36 -
 37
37 -
 38
38 -
 39
39 -
 40
40 -
 41
41 -
42
-
43
-
44
-
45
-
46
-
47
-
48
-
49
-
50
-
51
-
52
-
53
-
54
-
55
-
56
-
57
-
58
-
59
-
60
-
61
-
62
-
63
-
64
-
65
-
66
-
67
-
68
-
69
-
70
-
71
-
72
-
73
-
74
-
75
-
76
-
77
-
78
-
79
-
80
-
81
-
82
-
83
-
84
-
85
-
86
-
87
-
88
-
89
-
90
-
91
-
92
-
93
-
94
-
95
-
96
-
97
-
98
-
99
-
100
-
101
-
102
-
103
-
104
 |
 |

29
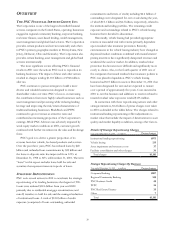
Strategic Repositioning Charges
By Income Statement Caption
Year ended December 31, 2001 – in millions Pretax charges
Provision for credit losses $714
Noninterest income
Corporate services 259
Net securities gains 5
Other 12
Noninterest expense
Staff expense 21
Equipment 1
Other 169
Total $1,181
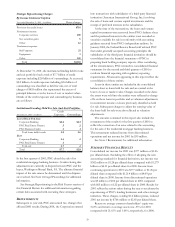
At December 31, 2001, the institutional lending held for sale
and exit portfolios had a total of $7.7 billion of credit
exposure including $2.8 billion of outstandings. At year end,
$5.0 billion of credit exposure including $2.6 billion of
outstandings was classified as held for sale, net of total
charges of $855 million that represented the excess of
principal balances over the lower of cost or market values.
Details of the credit exposure and outstandings by business
are as follows:
Institutional Lending Held For Sale And Exit Portfolios
December 31, 2001 – in billions
Credit
Exposure Outstandings
LOANS HELD FOR SALE
Corporate Banking $4.6 $2.3
PNC Real Estate Finance .3 .2
PNC Business Credit .1 .1
Total loans held for sale 5.0 2.6
EXIT
Corporate Banking 2.6 .2
PNC Real Estate Finance .1
Total exit 2.7 .2
Total $7.7 $2.8
In the first quarter of 2001, PNC closed the sale of its
residential mortgage banking business. Certain closing date
adjustments are currently in dispute between PNC and the
buyer, Washington Mutual Bank, FA. The ultimate financial
impact of the sale cannot be determined until the disputes
are resolved. See Note 24 Legal Proceedings for additional
information.
See Strategic Repositioning in the Risk Factors section of
this Financial Review for additional information regarding
certain risks associated with executing these strategies.
RESTATEMENTS
Subsequent to year end, PNC announced two changes that
affected 2001 results. During 2001, the Corporation entered
into transactions with subsidiaries of a third party financial
institution (American International Group, Inc.) involving
the sale of loans and venture capital investments and the
receipt of preferred interests in the subsidiaries.
At the time of the transactions, the loans and venture
capital investments were removed from PNC’s balance sheet
and the preferred interests in the entities were recorded as
securities available for sale in conformity with accounting
guidance received from PNC’s independent auditors. In
January 2002, the Federal Reserve Board staff advised PNC
that under generally accepted accounting principles the
subsidiaries of the third party financial institution should be
consolidated into the financial statements of PNC in
preparing bank holding company reports. After considering
all the circumstances, PNC restated its consolidated financial
statements for the second and third quarters of 2001 to
conform financial reporting with regulatory reporting
requirements. All amounts appearing in this report reflect the
consolidation of these entities.
Loans in these entities are included in the consolidated
balance sheet as loans held for sale and are carried at the
lower of cost or market value. Charges recorded at the dates
the assets were sold into the entities were reflected as charge-
offs on those loans in portfolio and as valuation adjustments
in noninterest income on loans previously classified as held
for sale. Subsequent charges to adjust the carrying value of
the loans held for sale were also reflected as valuation
adjustments.
The amounts contained in this report also include the
restatement of the results for the first quarter of 2001 to
reflect the correction of an error related to the accounting
for the sale of the residential mortgage banking business.
This restatement reduced income from discontinued
operations and net income for 2001 by $35 million.
See Note 3 Restatements for additional information.
SUMMARY FINANCIAL RESULTS
Consolidated net income for 2001 was $377 million or $1.26
per diluted share. Excluding the effect of adopting the new
accounting standard for financial derivatives, net income was
$382 million or $1.28 per diluted share compared with $1.279
billion or $4.31 per diluted share for 2000. Income from
continuing operations in 2001 was $377 million or $1.26 per
diluted share compared with $1.214 billion or $4.09 per
diluted share in 2000. Income from discontinued operations
was $5 million or $.02 per diluted share in 2001 compared
with $65 million or $.22 per diluted share in 2000. Results for
2001 reflect the actions taken during the year to accelerate the
repositioning of PNC’s lending businesses and other strategic
initiatives. These charges, totaling $1.2 billion pretax, reduced
2001 net income by $768 million or $2.65 per diluted share.
Return on average common shareholders’ equity was
5.65% and return on average assets was .53% for 2001
compared with 21.63% and 1.68%, respectively, for 2000.