PNC Bank 2001 Annual Report Download - page 53
Download and view the complete annual report
Please find page 53 of the 2001 PNC Bank annual report below. You can navigate through the pages in the report by either clicking on the pages listed below, or by using the keyword search tool below to find specific information within the annual report.-
 1
1 -
2
-
3
-
4
-
5
-
6
-
7
-
8
-
9
-
10
-
11
-
12
-
13
-
14
-
15
-
16
-
17
-
18
-
19
-
20
-
21
-
22
-
23
-
24
-
25
-
26
-
27
-
28
-
29
-
30
-
31
-
32
-
33
-
34
-
35
-
36
-
37
-
38
-
39
-
40
-
41
-
42
-
 43
43 -
 44
44 -
 45
45 -
 46
46 -
 47
47 -
 48
48 -
 49
49 -
 50
50 -
 51
51 -
 52
52 -
 53
53 -
 54
54 -
 55
55 -
 56
56 -
 57
57 -
 58
58 -
 59
59 -
 60
60 -
 61
61 -
 62
62 -
 63
63 -
64
-
65
-
66
-
67
-
68
-
69
-
70
-
71
-
72
-
73
-
74
-
75
-
76
-
77
-
78
-
79
-
80
-
81
-
82
-
83
-
84
-
85
-
86
-
87
-
88
-
89
-
90
-
91
-
92
-
93
-
94
-
95
-
96
-
97
-
98
-
99
-
100
-
101
-
102
-
103
-
104
 |
 |

51
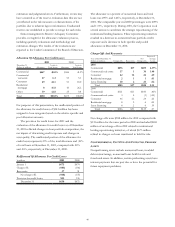
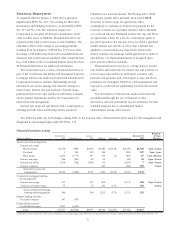
Interest Sensitivity Analysis
December 31 2001 2000
Net Interest Income Sensitivity Simulation
Effect on net interest income from
gradual interest rate change over
following 12 months of:
100 basis point increase (.3)% (.3)%
100 basis point decrease (2.8)% .4%
Economic Value of Equity Sensitivity Model
Effect on value of on- and off-balance-
sheet positions as a percentage of
assets from instantaneous change in
interest rates of:
200 basis point increase (1.4)% (.8)%
200 basis point decrease .5% (.1)%
Key Period-End Interest Rates
One month LIBO
R
1.87% 6.56%
Three-year swap 4.33% 5.89%
Current market interest rates, which are used as base rates in
the Corporation’s net interest income simulation and
economic value of equity models, have declined significantly
from year-end 2000 to year-end 2001.
The major sources of the change in net interest income
sensitivities from 2000 to 2001 are the effects of this decline
in rates on two of the key drivers of the simulation results.
First, the decline in market rates and the lowering of the
rates paid by PNC on transaction deposits have reduced the
expected impact that further rate declines could have on the
rate paid on transaction deposits. Second, the lower rate
environment has increased the effect that a further rate
decline could have on the anticipated prepayment rates of
mortgage-related assets.
Over the course of 2001, management has taken actions
to mitigate the adverse effects of significantly declining
interest rates on the Corporation’s net interest income.
Without these actions, the Corporation’s reported sensitivity
to a 100 basis point decline in interest rates at year end 2001
would have been significantly higher. These actions included
purchasing fixed-rate securities and financial derivatives. The
effects of these actions have contributed to the year-over-
year change in the Corporation’s economic value of equity
sensitivities. Thus far in 2002, management’s actions have
focused on reducing the effects of significantly higher
interest rates on the Corporation’s net interest income and
economic value of equity.
LIQUIDITY RISK
Liquidity represents the Corporation’s ability to obtain cost-
effective funding to meet the needs of customers as well as
the Corporation’s financial obligations. Liquidity is centrally
managed by Asset and Liability Management, with oversight
provided by the Corporate Asset and Liability Committee
and the Finance Committee of the Board of Directors.
The Corporation’s main sources of funds to meet its
liquidity requirements are access to the capital markets, sale
of liquid assets, secured advances from the Federal Home
Loan Bank, its core deposit base and the capability to
securitize assets for sale.
Access to capital markets is a key factor affecting liquidity
management. Access to such markets is in part based on the
Corporation’s credit ratings, which are influenced by a
number of factors including capital ratios, asset quality and
earnings. Additional factors that impact liquidity include the
maturity structure of existing assets, liabilities, and off-
balance-sheet positions, the level of liquid securities and
loans available for sale, regulatory capital classification, and
the Corporation’s ability to securitize and sell various types
of loans.
Liquid assets consist of short-term investments and
securities available for sale. At December 31, 2001, such
assets totaled $14.9 billion, with $6.2 billion pledged as
collateral for borrowings, trust and other commitments.
Secured advances from the Federal Home Loan Bank, of
which PNC Bank, N.A. (“PNC Bank”), PNC’s principal
bank subsidiary, is a member, are generally secured by
residential mortgages, other real-estate related loans and
mortgage-backed securities. At December 31, 2001,
approximately $10.6 billion of residential mortgages and
other real-estate related loans were available as collateral for
borrowings from the Federal Home Loan Bank. Funding can
also be obtained through alternative forms of borrowing,
including federal funds purchased, repurchase agreements
and short-term and long-term debt issuances.
Liquidity for the parent company and subsidiaries is also
generated through the issuance of securities in public or
private markets and lines of credit. At December 31, 2001,
the Corporation had unused capacity under effective shelf
registration statements of approximately $3.3 billion of debt
or equity securities and $400 million of trust preferred capital
securities. The Corporation had an unused line of credit of
$500 million at December 31, 2001.