PNC Bank 2001 Annual Report Download - page 60
Download and view the complete annual report
Please find page 60 of the 2001 PNC Bank annual report below. You can navigate through the pages in the report by either clicking on the pages listed below, or by using the keyword search tool below to find specific information within the annual report.-
 1
1 -
2
-
3
-
4
-
5
-
6
-
7
-
8
-
9
-
10
-
11
-
12
-
13
-
14
-
15
-
16
-
17
-
18
-
19
-
20
-
21
-
22
-
23
-
24
-
25
-
26
-
27
-
28
-
29
-
30
-
31
-
32
-
33
-
34
-
35
-
36
-
37
-
38
-
39
-
40
-
41
-
42
-
43
-
44
-
45
-
46
-
47
-
48
-
49
-
 50
50 -
 51
51 -
 52
52 -
 53
53 -
 54
54 -
 55
55 -
 56
56 -
 57
57 -
 58
58 -
 59
59 -
 60
60 -
 61
61 -
 62
62 -
 63
63 -
 64
64 -
 65
65 -
 66
66 -
 67
67 -
 68
68 -
 69
69 -
 70
70 -
71
-
72
-
73
-
74
-
75
-
76
-
77
-
78
-
79
-
80
-
81
-
82
-
83
-
84
-
85
-
86
-
87
-
88
-
89
-
90
-
91
-
92
-
93
-
94
-
95
-
96
-
97
-
98
-
99
-
100
-
101
-
102
-
103
-
104
 |
 |
58
2000 VERSUS 1999
CONSOLIDATED INCOME STATEMENT REVIEW
Summary Results
Income from continuing operations for 2000 was $1.214
billion or $4.09 per diluted share compared with $1.202
billion or $3.94 per diluted share, respectively, for 1999.
Return on average common shareholders’ equity was 20.52%
and return on average assets was 1.76% for 2000 compared
with 21.29% and 1.76%, respectively, for 1999.
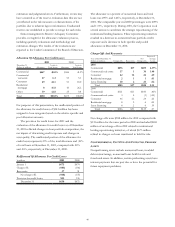
Net Interest Income
Taxable-equivalent net interest income of $2.182 billion for
2000 decreased $184 million or 8% compared with 1999. The
net interest margin of 3.64% for 2000 narrowed 22 basis
points from 3.86% in the prior year. These decreases were
primarily due to funding costs related to the ISG acquisition,
changes in balance sheet composition and a higher interest
rate environment in 2000.
Provision For Credit Losses
The provision for credit losses was $136 million for 2000
compared with $163 million for 1999. Net charge-offs were
$135 million or .27% of average loans for 2000 compared
with $161 million or .31%, respectively, for 1999. The
decrease in the provision was primarily due to the sale of the
credit card business in the first quarter of 1999, partially
offset by higher commercial loan net charge-offs in 2000.
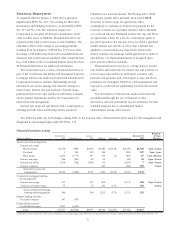
Noninterest Income
Noninterest income was $2.891 billion for 2000 and
represented 57% of total revenue compared with $2.450
billion and 51%, respectively, for 1999. The increase was
primarily driven by growth in certain fee-based businesses,
the benefit of the ISG acquisition and higher equity
management income.
Asset management fees of $809 million for 2000
increased $128 million or 19% primarily driven by new
business. Assets under management were $253 billion at
December 31, 2000, a 19% increase compared with
December 31, 1999. Fund servicing fees of $654 million for
2000 increased $403 million compared with 1999 primarily
due to the ISG acquisition. Excluding ISG, fund servicing
fees increased 22% mainly due to existing and new client
growth.
Service charges on deposits of $206 million for 2000
were consistent with the prior year. Brokerage fees of $249
million for 2000 increased $30 million or 14% compared
with 1999 reflecting expansion of Hilliard Lyons’ distribution
network. Consumer services revenue of $209 million for
2000 increased 7% compared with the prior year, excluding
credit card fees, primarily due to higher consumer
transaction volume.
Corporate services revenue was $342 million for 2000
compared with $133 million for 1999. The increase in
corporate services revenue was primarily driven by the
comparative impact of valuation adjustments in the prior
year and higher treasury management and commercial
mortgage servicing fees that were partially offset by a lower
level of commercial mortgage-backed securitization gains due
to the impact of weaker capital market conditions.
Equity management income was $133 million for 2000
compared to $100 million in the prior year.
Net securities gains were $20 million for 2000 compared
with $22 million for 1999. The net securities gains in 1999
included a $41 million gain from the sale of Concord EFS,
Inc. stock that was partially offset by a $28 million write-
down of an equity investment.
Sale of subsidiary stock of $64 million in 1999 reflected
the gain from the BlackRock initial public offering.
Other noninterest income was $269 million for 2000
compared with $555 million for 1999. The decrease resulted
primarily from the comparative impact of gains in 1999 from
the sale of the credit card business of $193 million and from
the sale of an equity interest in Electronic Payment Services,
Inc. of $97 million.
Noninterest Expense
Noninterest expense was $3.071 billion and the efficiency
ratio was 56.85% for 2000 compared with $2.843 billion and
55.54%, respectively, for 1999. The increases were primarily
related to the ISG acquisition. Average full-time equivalent
employees totaled approximately 24,100 and 22,700 for 2000
and 1999, respectively. The increase was primarily due to the
ISG acquisition, partially offset by the impact of efficiency
initiatives in traditional banking businesses and the sale of the
credit card business in 1999.