PNC Bank 2001 Annual Report Download - page 91
Download and view the complete annual report
Please find page 91 of the 2001 PNC Bank annual report below. You can navigate through the pages in the report by either clicking on the pages listed below, or by using the keyword search tool below to find specific information within the annual report.-
 1
1 -
2
-
3
-
4
-
5
-
6
-
7
-
8
-
9
-
10
-
11
-
12
-
13
-
14
-
15
-
16
-
17
-
18
-
19
-
20
-
21
-
22
-
23
-
24
-
25
-
26
-
27
-
28
-
29
-
30
-
31
-
32
-
33
-
34
-
35
-
36
-
37
-
38
-
39
-
40
-
41
-
42
-
43
-
44
-
45
-
46
-
47
-
48
-
49
-
50
-
51
-
52
-
53
-
54
-
55
-
56
-
57
-
58
-
59
-
60
-
61
-
62
-
63
-
64
-
65
-
66
-
67
-
68
-
69
-
70
-
71
-
72
-
73
-
74
-
75
-
76
-
77
-
78
-
79
-
80
-
 81
81 -
 82
82 -
 83
83 -
 84
84 -
 85
85 -
 86
86 -
 87
87 -
 88
88 -
 89
89 -
 90
90 -
 91
91 -
 92
92 -
 93
93 -
 94
94 -
 95
95 -
 96
96 -
 97
97 -
 98
98 -
 99
99 -
 100
100 -
 101
101 -
102
-
103
-
104
 |
 |

89
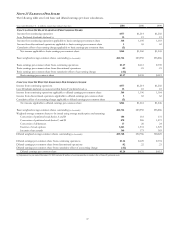
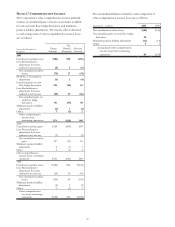
Results Of Businesses
Year ended December 31
In millions
Regional
Community
Banking
Corporate
Banking
PNC
Real Estate
Finance
PNC
Business
Credit
PNC
Advisors BlackRock PFPC Other Consolidated
2001
INCOME STATEMENT
Net interest income $1
,
460 $501 $116 $104 $128 $11 $
(
66
)
$8 $2
,
262
Noninterest income 758 32 89
(
8
)
607 533 726
(
194
)
2
,
543
T
otal revenue 2
,
218 533 205 96 735 544 660
(
186
)
4
,
805
Provision for credit losses 50 733 44 29 2 45 903
Depreciation and amortization 71 13 22 2 17 26 45 77 273
Other noninterest expense 1,169 374 136 29 487 337 554 (21) 3,065
Pretax earnings 928 (587) 3 36 229 181 61 (287) 564
Income taxes 332
(
212
)
(
35
)
14 86 74 25
(
97
)
187
Earnings $596 $(375) $38 $22 $143 $107 $36 $(190) $377
Inter-segment revenue $11 $4 $61 $16 $6 $(98)
AVERAGE ASSETS $40,285 $16,685 $5,290 $2,463 $3,330 $684 $1,771 $(153) $70,355
2000
I
NCOME
S
TATEMENT
Net interest income $1
,
408 $582 $118 $99 $136 $7 $
(
46
)
$
(
140
)
$2
,
164
Noninterest income 619 254 108 20 656 477 656 101 2
,
891
T
otal revenue 2
,
027 836 226 119 792 484 610
(
39
)
5
,
055
Provision for credit losses 45 79
(
7
)
12 5 2 136
Depreciation and amortization 71 13 20 2 14 20 49 70 259
Other noninterest expense 1,000 381 125 28 497 314 483 (16) 2,812
Pretax earnings 911 363 88 77 276 150 78 (95) 1,848
Income taxes 321 122 4 28 103 63 31
(
38
)
634
Earnings $590 $241 $84 $49 $173 $87 $47 $(57) $1,214
Inter-segment revenue $3 $5 $79 $13 $5 $(105)
AVERAGE ASSETS $38,958 $17,746 $5,889 $2,271 $3,500 $537 $1,578 $(1,988) $68,491
1999
I
NCOME
S
TATEMENT
Net interest income $1
,
411 $534 $132 $71 $130 $
(
8
)
$6 $68 $2
,
344
Noninterest income 667 85 67 11 608 381 251 380 2
,
450
T
otal revenue 2
,
078 619 199 82 738 373 257 448 4
,
794
Provision for credit losses 61 16 9 11 7 59 163
Depreciation and amortization 96 18 22 2 18 18 12 110 296
Other noninterest expense 1,002 381 118 23 483 252 175 113 2,547
Pretax earnings 919 204 50 46 230 103 70 166 1,788
Income taxes 326 59 17 88 44 26 26 586
Earnings $593 $145 $50 $29 $142 $59 $44 $140 $1,202
Inter-segment revenue $6 $2 $(1) $81 $10 $3 $(101)
AVERAGE ASSETS $37,502 $18,041 $7,133 $1,759 $3,353 $448 $308 $(630) $67,914
Gains on the sales of the credit card business, the
BlackRock IPO and Concord stock totaling $298 million in
1999 are included in the “Other” category. Also in 1999,
costs related to efficiency initiatives of $48 million and a
contribution to the PNC Foundation of $30 million are
included in the “Other” category.
Differences between management accounting practices
and generally accepted accounting principles, divested and
exited businesses, equity management activities, minority
interest in income of consolidated entities, residual asset
and liability management activities, eliminations and
unassigned items comprise the remainder of the “Other”
category.