PNC Bank 2001 Annual Report Download - page 52
Download and view the complete annual report
Please find page 52 of the 2001 PNC Bank annual report below. You can navigate through the pages in the report by either clicking on the pages listed below, or by using the keyword search tool below to find specific information within the annual report.-
 1
1 -
2
-
3
-
4
-
5
-
6
-
7
-
8
-
9
-
10
-
11
-
12
-
13
-
14
-
15
-
16
-
17
-
18
-
19
-
20
-
21
-
22
-
23
-
24
-
25
-
26
-
27
-
28
-
29
-
30
-
31
-
32
-
33
-
34
-
35
-
36
-
37
-
38
-
39
-
40
-
41
-
 42
42 -
 43
43 -
 44
44 -
 45
45 -
 46
46 -
 47
47 -
 48
48 -
 49
49 -
 50
50 -
 51
51 -
 52
52 -
 53
53 -
 54
54 -
 55
55 -
 56
56 -
 57
57 -
 58
58 -
 59
59 -
 60
60 -
 61
61 -
 62
62 -
63
-
64
-
65
-
66
-
67
-
68
-
69
-
70
-
71
-
72
-
73
-
74
-
75
-
76
-
77
-
78
-
79
-
80
-
81
-
82
-
83
-
84
-
85
-
86
-
87
-
88
-
89
-
90
-
91
-
92
-
93
-
94
-
95
-
96
-
97
-
98
-
99
-
100
-
101
-
102
-
103
-
104
 |
 |
50
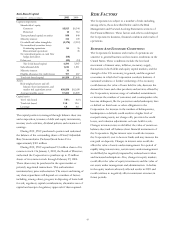
CREDIT-RELATED INSTRUMENTS
Credit default swaps provide, for a fee, an assumption of a
portion of the credit risk associated with the underlying
financial instruments. The Corporation primarily uses such
contracts to mitigate credit risk associated with commercial
lending activities. At December 31, 2001, credit default
swaps of $198 million in notional value were used by the
Corporation to hedge credit risk associated with commercial
lending activities.
INTEREST RATE RISK
Interest rate risk arises primarily through the Corporation’s
traditional business activities of extending loans and accepting
deposits. Many factors, including economic and financial
conditions, movements in interest rates and consumer
preferences affect the spread between interest earned on assets
and interest paid on liabilities. In managing interest rate risk,
the Corporation seeks to minimize its reliance on a particular
interest rate scenario as a source of earnings while
maximizing net interest income and net interest margin. To
further these objectives, the Corporation uses securities
purchases and sales, short-term and long-term funding,
financial derivatives and other capital markets instruments.
Interest rate risk is centrally managed by Asset and
Liability Management. The Corporation actively measures
and monitors components of interest rate risk including term
structure or repricing risk, yield curve or nonparallel rate
shift risk, basis risk and options risk. The Corporation
measures and manages both the short-term and long-term
effects of changing interest rates. An income simulation
model is designed to measure the sensitivity of net interest
income to changing interest rates over the next twenty-four
month period. An economic value of equity model is
designed to measure the sensitivity of the value of existing
on-balance-sheet and off-balance-sheet positions to changing
interest rates.
The income simulation model is the primary tool
used to measure the direction and magnitude of changes in
net interest income resulting from changes in interest rates.
Forecasting net interest income and its sensitivity to changes
in interest rates requires that the Corporation make
assumptions about the volume and characteristics of new
business and the behavior of existing positions. These
business assumptions are based on the Corporation’s
experience, business plans and published industry
experience. Key assumptions employed in the model include
prepayment speeds on mortgage-related assets and consumer
loans, loan volumes and pricing, deposit volumes and
pricing, the expected life and repricing characteristics of
nonmaturity loans and deposits, and management’s financial
and capital plans.
Because these assumptions are inherently uncertain, the
model cannot precisely estimate net interest income or
precisely predict the effect of higher or lower interest rates
on net interest income. Actual results will differ from
simulated results due to the timing, magnitude and frequency
of interest rate changes, the difference between actual
experience and the assumed volume and characteristics of
new business and behavior of existing positions, and changes
in market conditions and management strategies, among
other factors.
The Corporation models additional interest rate scenarios
covering a wider range of rate movements to identify yield
curve, term structure and basis risk exposures. These
scenarios are developed based on historical rate relationships
or management’s expectations regarding the future direction
and level of interest rates. Depending on market conditions
and other factors, these scenarios may be modeled more or
less frequently. Such analyses are used to identify risk and
develop strategies.
An economic value of equity model is used by the
Corporation to value all current on-balance-sheet and off-
balance-sheet positions under a range of instantaneous
interest rate changes. The resulting change in the value of
equity is a measure of overall long-term interest rate risk
inherent in the Corporation’s existing on-balance-sheet and
off-balance-sheet positions. The Corporation uses the
economic value of equity model to complement the net
interest income simulation modeling process.
The Corporation’s interest rate risk management policies
provide that net interest income should not decrease by
more than 3% if interest rates gradually increase or decrease
from current rates by 100 basis points over a twelve-month
period and that the economic value of equity should not
decline by more than 1.5% of the book value of assets for a
200 basis point instantaneous increase or decrease in interest
rates. Policy exceptions, if any, are reported to the Finance
Committee of the Board of Directors.
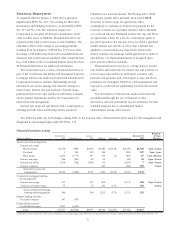
The following table sets forth the sensitivity results for
the last two years.