PNC Bank 2001 Annual Report Download - page 100
Download and view the complete annual report
Please find page 100 of the 2001 PNC Bank annual report below. You can navigate through the pages in the report by either clicking on the pages listed below, or by using the keyword search tool below to find specific information within the annual report.-
 1
1 -
2
-
3
-
4
-
5
-
6
-
7
-
8
-
9
-
10
-
11
-
12
-
13
-
14
-
15
-
16
-
17
-
18
-
19
-
20
-
21
-
22
-
23
-
24
-
25
-
26
-
27
-
28
-
29
-
30
-
31
-
32
-
33
-
34
-
35
-
36
-
37
-
38
-
39
-
40
-
41
-
42
-
43
-
44
-
45
-
46
-
47
-
48
-
49
-
50
-
51
-
52
-
53
-
54
-
55
-
56
-
57
-
58
-
59
-
60
-
61
-
62
-
63
-
64
-
65
-
66
-
67
-
68
-
69
-
70
-
71
-
72
-
73
-
74
-
75
-
76
-
77
-
78
-
79
-
80
-
81
-
82
-
83
-
84
-
85
-
86
-
87
-
88
-
89
-
 90
90 -
 91
91 -
 92
92 -
 93
93 -
 94
94 -
 95
95 -
 96
96 -
 97
97 -
 98
98 -
 99
99 -
 100
100 -
 101
101 -
 102
102 -
 103
103 -
 104
104
 |
 |

98
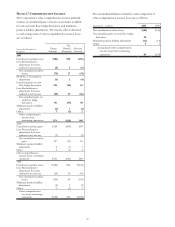
SUMMARY OF LOAN LOSS EXPERIENCE
Year ended December 31 - dollars in millions 2001 2000 1999 1998 1997
Allowance at beginning of year $675 $674 $753 $972 $1,166
Charge-offs
Commercial 876 121 72 122 48
Commercial real estate
Commercial mortgage 2 1 6 8
Real estate project 37 1324
Consumer 42 46 63 83 104
Residential mortgage 28879
Lease financing 28 8974
Credit card 60 297 208
Total charge-offs 985 186 216 524 385
Recoveries
Commercial 17 21 22 20 38
Commercial real estate
Commercial mortgage 3 1 2 10
Real estate project 11312
Consumer 16 22 25 34 36
Residential mortgage 12111
Lease financing 2212
Credit card 21725
Other 1
Total recoveries 37 51 55 77 113
Net charge-offs 948 135 161 447 272
Provision for credit losses 903 136 163 225 70
(Divestitures)/acquisitions (81) 3 8
Allowance at end of year $630 $675 $674 $753 $972
Allowance as a percent of period-end
Loans 1.66% 1.33% 1.36% 1.31% 1.79%
Nonaccrual loans 298.58 208.98 231.62 263.29 360.00
As a percent of average loans
Net charge-offs (a) 2.12 .27 .31 .80 .51
Provision for credit losses (b) 2.01 .27 .31 .40 .13
Allowance for credit losses 1.41 1.35 1.28 1.35 1.84
A
llowance as a multiple of net charge-offs (a) .66x 5.00x 4.19x 1.68x 3.57x
(a) Excluding $804 million of net charge-offs in 2001 related to the institutional lending repositioning initiative, net charge-offs would be .32% of average loans and the allowance as a
multiple of net charge-offs would be 4.38x.
(b) Excluding $714 million of provision in 2001 related to the institutional lending repositioning initiative, provision for credit losses would be .42% of average loans.
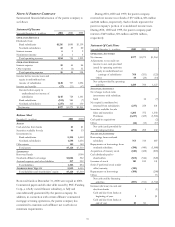
The following table presents the allocation of allowance for credit losses and the categories of loans as a percentage of total
loans. For purposes of this presentation, the unallocated portion of the allowance for credit losses has been assigned to loan
categories based on the relative specific and pool allocation amounts. At December 31, 2001, the unallocated portion was $143
million.
ALLOCATION OF ALLOWANCE FOR CREDIT LOSSES
2001 2000 1999 1998 1997
December 31
Dollars in millions Allowance
Loans to
Total Loans Allowance
Loans to
Total Loans Allowance
Loans to
Total Loans Allowance
Loans to
Total Loans Allowance
Loans to
Total Loans
Commercial $467 40.0% $536 41.9% $510 43.2% $446 43.7% $406 36.9%
Commercial real
estate 67 6.3 53 5.1 64 5.5 59 6.0 141 7.3
Consumer 49 24.1 51 18.0 58 18.8 74 19.0 107 20.7
Residential
mortgage 816.8 10 26.2 10 25.2 8 21.3 42 23.6
Credit card 136 5.1 258 7.0
Other 39 12.8 25 8.8 32 7.3 30 4.9 18 4.5
Total $630 100.0% $675 100.0% $674 100.0% $753 100.0% $972 100%