PNC Bank 2001 Annual Report Download - page 42
Download and view the complete annual report
Please find page 42 of the 2001 PNC Bank annual report below. You can navigate through the pages in the report by either clicking on the pages listed below, or by using the keyword search tool below to find specific information within the annual report.-
 1
1 -
2
-
3
-
4
-
5
-
6
-
7
-
8
-
9
-
10
-
11
-
12
-
13
-
14
-
15
-
16
-
17
-
18
-
19
-
20
-
21
-
22
-
23
-
24
-
25
-
26
-
27
-
28
-
29
-
30
-
31
-
 32
32 -
 33
33 -
 34
34 -
 35
35 -
 36
36 -
 37
37 -
 38
38 -
 39
39 -
 40
40 -
 41
41 -
 42
42 -
 43
43 -
 44
44 -
 45
45 -
 46
46 -
 47
47 -
 48
48 -
 49
49 -
 50
50 -
 51
51 -
 52
52 -
53
-
54
-
55
-
56
-
57
-
58
-
59
-
60
-
61
-
62
-
63
-
64
-
65
-
66
-
67
-
68
-
69
-
70
-
71
-
72
-
73
-
74
-
75
-
76
-
77
-
78
-
79
-
80
-
81
-
82
-
83
-
84
-
85
-
86
-
87
-
88
-
89
-
90
-
91
-
92
-
93
-
94
-
95
-
96
-
97
-
98
-
99
-
100
-
101
-
102
-
103
-
104
 |
 |
40
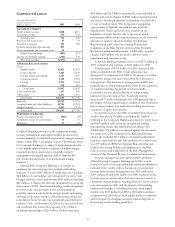
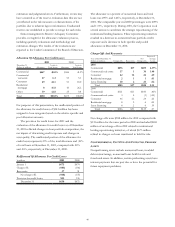
Securities represented 18% of average interest-earning assets
for 2001 compared with 10% for 2000. The increase was
primarily due to the retention of interests from the
securitization of residential mortgage loans and net securities
purchases upon redeployment of funds resulting from loan
downsizing and interest rate risk management activities.
Funding cost is affected by the volume and composition
of funding sources as well as related rates paid thereon.
Average deposits comprised 64% and 66% of total sources of
funds for 2001 and 2000, respectively, with the remainder
primarily comprised of wholesale funding obtained at
prevailing market rates.
Average interest-bearing demand and money market
deposits increased $2.6 billion or 14% compared with 2000,
primarily reflecting the impact of strategic marketing
initiatives to grow more valuable transaction accounts, while
all other interest-bearing deposit categories decreased in the
year-to-year comparison as management de-emphasized these
more costly sources of funds. Average borrowed funds for
2001 were essentially flat compared with 2000.
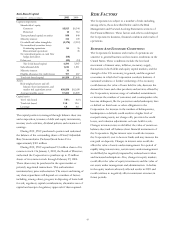
PROVISION FOR CREDIT LOSSES
The provision for credit losses was $903 million for 2001
compared with $136 million for 2000. The increase was
primarily related to provision expense of $714 million to
provide for net charge-offs associated with institutional
lending repositioning initiatives in 2001. As a result of these
charge-offs and other reserve activity in 2001, the allowance
for credit losses was $630 million at December 31, 2001
compared with $675 million at December 31, 2000. See Credit
Risk in the Risk Management section and Critical Accounting
Policies and Judgments in the Risk Factors section of this
Financial Review for additional information regarding credit
risk.
NONINTEREST INCOME
Noninterest income was $2.543 billion for 2001 compared
with $2.891 billion in 2000.
Asset management fees of $848 million for 2001 increased
$39 million or 5% primarily driven by new institutional
business and strong fixed-income performance at BlackRock
which more than offset decreases at PNC Advisors primarily
due to the impact of declining equity markets. Consolidated
assets under management were $284 billion at December 31,
2001, a 12% increase compared with December 31, 2000.
Fund servicing fees were $724 million for 2001, a $70 million
increase compared with 2000 primarily driven by new client
growth.
Service charges on deposits increased 6% to $218 million
for 2001 mainly due to an increase in transaction deposit
accounts. Brokerage fees were $206 million for 2001
compared with $249 million for 2000 as increased fees from
sales of insurance products were more than offset by declines
in other brokerage revenue due to weak equity markets.
Consumer services revenue of $229 million for 2001
increased $20 million or 10% compared with 2000 mainly
due to the expansion of PNC’s ATM network and the
increase in transaction deposit accounts.
Corporate services revenue was $60 million for 2001
compared with $342 million for 2000. Revenue in 2001 was
adversely impacted by valuation adjustments on loans held
for sale of $259 million. In addition, increases in treasury
management and CMBS servicing revenue were more than
offset by the comparative impact of losses resulting from
lower valuations of equity investments and lower capital
markets fees in 2001.
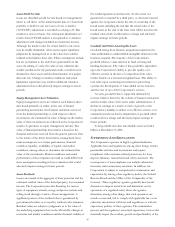
Equity management, which is comprised of venture
capital activities, reflected net losses of $179 million for 2001
compared with net gains of $133 million in 2000. The
decrease primarily resulted from a decline in the estimated
fair value of both limited partnership and direct investments.
At December 31, 2001, equity management investments held
by PNC and consolidated subsidiaries totaled approximately
$574 million. Approximately 53% of that amount is invested
directly in a variety of companies and 47% is invested in
various limited partnerships. The valuation of equity
management assets is subject to the performance of the
underlying companies as well as market conditions and may
be volatile. The Corporation’s strategy in equity management
is to attract funding from investors and generate a greater
proportion of revenues from fees earned by managing
investments for others. See Business and Economic
Conditions and Critical Accounting Policies and Judgments
in the Risk Factors section of this Financial Review for
additional information regarding equity management assets.
Net securities gains were $131 million for 2001 compared
with $20 million in 2000.
Other noninterest income was $306 million for 2001
compared with $269 million for 2000. Excluding $12 million
of asset write-downs in the fourth quarter of 2001, other
noninterest income increased 18% primarily due to higher
revenue from trading activities and gains on the sale of
residential mortgage loans. Net trading income included in
other noninterest income was $142 million in 2001 compared
with $84 million in 2000. See details in Note 7 Trading
Activities.