PNC Bank 2001 Annual Report Download - page 43
Download and view the complete annual report
Please find page 43 of the 2001 PNC Bank annual report below. You can navigate through the pages in the report by either clicking on the pages listed below, or by using the keyword search tool below to find specific information within the annual report.
41
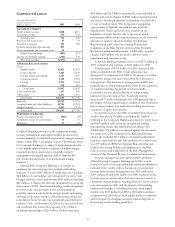
NONINTEREST EXPENSE
Noninterest expense was $3.338 billion for 2001 compared
with $3.071 billion for 2000. Costs to exit the vehicle leasing
business, including the impairment of goodwill associated
with a prior acquisition and employee severance costs, and
additions to reserves related to insured residual value
exposures totaled $135 million and are included in 2001
noninterest expense. In addition, $56 million of integration
and severance costs related to other strategic initiatives were
incurred in 2001. Excluding these items, noninterest expense
increased 2% compared with 2000. The increase was
primarily in businesses that have shown higher revenue
growth including Regional Community Banking, BlackRock
and PFPC. Average full-time equivalent employees totaled
approximately 24,500 and 24,100 for 2001 and 2000,
respectively. The increase was mainly in asset management
and processing businesses.
CONSOLIDATED BALANCE SHEET
REVIEW
LOANS
Loans were $38.0 billion at December 31, 2001, a decrease of
$12.6 billion from year end 2000 primarily due to residential
mortgage securitizations and runoff, transfers to held for sale
and the managed reduction of institutional loans.
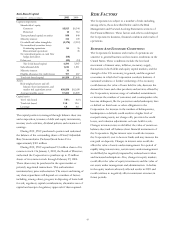
Details Of Loans
December 31 - in millions 2001 2000
Commercial
Manufacturing $3,352 $5,581
Retail/wholesale 3,856 4,413
Service providers 2,136 2,944
Real estate related 1,720 1,783
Financial services 1,362 1,726
Communications 139 1,296
Health care 517 722
Other 2,123 2,742
Total commercial 15,205 21,207
Commercial real estate
Mortgage 592 673
Real estate project 1,780 1,910
Total commercial real
estate 2,372 2,583
Consumer
Home equity 7,016 6,228
Automobile 773 1,166
Other 1,375 1,739
Total consumer 9,164 9,133
Residential mortgage 6,395 13,264
Lease financing 5,557 4,845
Other 445 568
Unearned income (1,164) (999)
Total, net of unearned income $37,974 $50,601
At December 31, 2001, loans of $38.0 billion included $1.9
billion of vehicle leases and $200 million of commercial loans
that have been designated for exit.
LOANS HELD FOR SALE
Loans held for sale were $4.2 billion at December 31, 2001
compared with $1.7 billion at December 31, 2000. In the
fourth quarter of 2001, PNC designated for exit $3.1 billion
of loans and $7.9 billion of institutional credit exposure. Of
these amounts, $2.3 billion, net of $.6 billion of related
charges, with total credit exposure of $4.6 billion were
transferred to loans held for sale. Approximately $276
million of loans held at December 31, 2001 by subsidiaries of
a third-party financial institution are classified in the
consolidated financial statements as loans held for sale.
Substantially all student loans are classified as loans held for
sale. See Note 14 Securitizations for information as to any
interests retained in these loans.
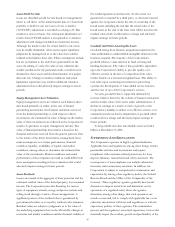
Details Of Loans Held For Sale
December 31 – in millions 2001 2000
Institutional lending repositioning $2,568 $286
Student loans 1,340 1,201
Other 281 168
Total loans held for sale $4,189 $1,655
See Strategic Repositioning and Critical Accounting Policies
and Judgments in the Risk Factors section of this Financial
Review for additional information regarding loans held for
sale.
SECURITIES
Total securities at December 31, 2001 were $13.9 billion
compared with $5.9 billion at December 31, 2000. Total
securities represented 20% of total assets at December 31,
2001 compared with 8% at December 31, 2000. The increase
was primarily due to purchases of mortgage-backed and
asset-backed securities during 2001 and the retention of
interests from the securitization of residential mortgage loans
as loans declined and were replaced with securities.
At December 31, 2001, the securities available for sale
balance included a net unrealized loss of $132 million, which
represented the difference between fair value and amortized
cost. The comparable amount at December 31, 2000 was a net
unrealized loss of $54 million. Net unrealized gains and losses
in the securities available for sale portfolio are included in
accumulated other comprehensive income or loss, net of tax or,
for the portion attributable to a hedged risk as part of a fair
value hedge strategy, in net income. The expected weighted-
average life of securities available for sale was 4 years at


