Nokia 2009 Annual Report Download - page 97
Download and view the complete annual report
Please find page 97 of the 2009 Nokia annual report below. You can navigate through the pages in the report by either clicking on the pages listed below, or by using the keyword search tool below to find specific information within the annual report.-
 1
1 -
2
-
3
-
4
-
5
-
6
-
7
-
8
-
9
-
10
-
11
-
12
-
13
-
14
-
15
-
16
-
17
-
18
-
19
-
20
-
21
-
22
-
23
-
24
-
25
-
26
-
27
-
28
-
29
-
30
-
31
-
32
-
33
-
34
-
35
-
36
-
37
-
38
-
39
-
40
-
41
-
42
-
43
-
44
-
45
-
46
-
47
-
48
-
49
-
50
-
51
-
52
-
53
-
54
-
55
-
56
-
57
-
58
-
59
-
60
-
61
-
62
-
63
-
64
-
65
-
66
-
67
-
68
-
69
-
70
-
71
-
72
-
73
-
74
-
75
-
76
-
77
-
78
-
79
-
80
-
81
-
82
-
83
-
84
-
85
-
86
-
 87
87 -
 88
88 -
 89
89 -
 90
90 -
 91
91 -
 92
92 -
 93
93 -
 94
94 -
 95
95 -
 96
96 -
 97
97 -
 98
98 -
 99
99 -
 100
100 -
 101
101 -
 102
102 -
 103
103 -
 104
104 -
 105
105 -
 106
106 -
 107
107 -
108
-
109
-
110
-
111
-
112
-
113
-
114
-
115
-
116
-
117
-
118
-
119
-
120
-
121
-
122
-
123
-
124
-
125
-
126
-
127
-
128
-
129
-
130
-
131
-
132
-
133
-
134
-
135
-
136
-
137
-
138
-
139
-
140
-
141
-
142
-
143
-
144
-
145
-
146
-
147
-
148
-
149
-
150
-
151
-
152
-
153
-
154
-
155
-
156
-
157
-
158
-
159
-
160
-
161
-
162
-
163
-
164
-
165
-
166
-
167
-
168
-
169
-
170
-
171
-
172
-
173
-
174
-
175
-
176
-
177
-
178
-
179
-
180
-
181
-
182
-
183
-
184
-
185
-
186
-
187
-
188
-
189
-
190
-
191
-
192
-
193
-
194
-
195
-
196
-
197
-
198
-
199
-
200
-
201
-
202
-
203
-
204
-
205
-
206
-
207
-
208
-
209
-
210
-
211
-
212
-
213
-
214
-
215
-
216
-
217
-
218
-
219
-
220
-
221
-
222
-
223
-
224
-
225
-
226
-
227
-
228
-
229
-
230
-
231
-
232
-
233
-
234
-
235
-
236
-
237
-
238
-
239
-
240
-
241
-
242
-
243
-
244
-
245
-
246
-
247
-
248
-
249
-
250
-
251
-
252
-
253
-
254
-
255
-
256
-
257
-
258
-
259
-
260
-
261
-
262
-
263
-
264
 |
 |

In 2009, Devices & Services operating profit decreased 43% to EUR 3 314 million compared with
EUR 5 816 million in 2008, with a 11.9% operating margin, down from 16.6% in 2008. The decrease
in operating profit in 2009 was primarily driven by lower net sales compared to 2008 which was
partially offset by the operating expense reductions described above.
NAVTEQ
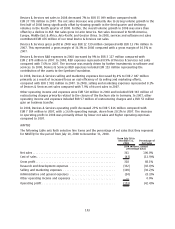
The following table sets forth selective line items and the percentage of net sales that they represent
for NAVTEQ for the fiscal year 2009 and for the period from July 10, 2008 to December 31, 2008.
Year Ended
December 31,
2009
Percentage of
Net Sales
From July 10 to
December 31,
2008
Percentage of
Net Sales
(EUR millions, except percentage data)
Net sales .......................... 670 100.0% 361 100.0%
Cost of sales ........................ (88) (13.1)% (43) (11.9)%
Gross profit ........................ 582 86.9% 318 88.1%
Research and development expenses .... (653) (97.5)% (332) (92.0)%
Selling and marketing expenses ........ (217) (32.4)% (109) (30.2)%
Administrative and general expenses .... (57) (8.5)% (30) (8.3)%
Other operating income and expenses . . . 1 0.1% — 0.0%
Operating profit ..................... (344) (51.3)% (153) (42.4)%
NAVTEQ net sales were EUR 670 million in 2009 compared with EUR 361 million for the period from
July 10, 2008 to December 31, 2008. Net sales were driven by the licensing of NAVTEQ’s geographic
database and related locationbased content. NAVTEQ’s sales were negatively affected by the
economic downturn primarily as a result of a decrease in overall vehicle sales in Europe and North
America and consumer trend towards the purchase of lowerend car classes. The following table sets
forth NAVTEQ net sales by geographic area for the fiscal year 2009 and for the period from July 10,
2008 to December 31, 2008.
For the Year Ended
December 31,
2009
From July 10 to
December 31,
2008
(EUR millions) (EUR millions)
Europe ................................................. 312 158
Middle East & Africa ....................................... 29 29
China .................................................. 5 2
AsiaPacific .............................................. 18 10
North America ........................................... 293 155
Latin America ............................................ 13 7
Total . .................................................. 670 361
For the fiscal year 2009, NAVTEQ gross profit was EUR 582 million compared with EUR 318 million for
the period from July 10, 2008 to December 31, 2008. Gross profit reflects net sales, partially offset by
costs related to the delivery of NAVTEQ’s database information to its customers.
NAVTEQ R&D expenses in 2009 were EUR 653 million compared with EUR 332 million for the period
from July 10, 2008 to December 31, 2008. NAVTEQ R&D expenses included amortization of intangible
assets recorded as part of Nokia’s acquisition of NAVTEQ totaling EUR 346 million and EUR 171 million
in 2009 and 2008, respectively. R&D expenses were also driven by increased investment in NAVTEQ’s
map database related to geographic expansion and quality improvements. R&D expenses represented
97.5% of NAVTEQ net sales in 2009 compared to 92.0% of NAVTEQ net sales in 2008.
95