Nokia 2009 Annual Report Download - page 145
Download and view the complete annual report
Please find page 145 of the 2009 Nokia annual report below. You can navigate through the pages in the report by either clicking on the pages listed below, or by using the keyword search tool below to find specific information within the annual report.-
 1
1 -
2
-
3
-
4
-
5
-
6
-
7
-
8
-
9
-
10
-
11
-
12
-
13
-
14
-
15
-
16
-
17
-
18
-
19
-
20
-
21
-
22
-
23
-
24
-
25
-
26
-
27
-
28
-
29
-
30
-
31
-
32
-
33
-
34
-
35
-
36
-
37
-
38
-
39
-
40
-
41
-
42
-
43
-
44
-
45
-
46
-
47
-
48
-
49
-
50
-
51
-
52
-
53
-
54
-
55
-
56
-
57
-
58
-
59
-
60
-
61
-
62
-
63
-
64
-
65
-
66
-
67
-
68
-
69
-
70
-
71
-
72
-
73
-
74
-
75
-
76
-
77
-
78
-
79
-
80
-
81
-
82
-
83
-
84
-
85
-
86
-
87
-
88
-
89
-
90
-
91
-
92
-
93
-
94
-
95
-
96
-
97
-
98
-
99
-
100
-
101
-
102
-
103
-
104
-
105
-
106
-
107
-
108
-
109
-
110
-
111
-
112
-
113
-
114
-
115
-
116
-
117
-
118
-
119
-
120
-
121
-
122
-
123
-
124
-
125
-
126
-
127
-
128
-
129
-
130
-
131
-
132
-
133
-
134
-
 135
135 -
 136
136 -
 137
137 -
 138
138 -
 139
139 -
 140
140 -
 141
141 -
 142
142 -
 143
143 -
 144
144 -
 145
145 -
 146
146 -
 147
147 -
 148
148 -
 149
149 -
 150
150 -
 151
151 -
 152
152 -
 153
153 -
 154
154 -
 155
155 -
156
-
157
-
158
-
159
-
160
-
161
-
162
-
163
-
164
-
165
-
166
-
167
-
168
-
169
-
170
-
171
-
172
-
173
-
174
-
175
-
176
-
177
-
178
-
179
-
180
-
181
-
182
-
183
-
184
-
185
-
186
-
187
-
188
-
189
-
190
-
191
-
192
-
193
-
194
-
195
-
196
-
197
-
198
-
199
-
200
-
201
-
202
-
203
-
204
-
205
-
206
-
207
-
208
-
209
-
210
-
211
-
212
-
213
-
214
-
215
-
216
-
217
-
218
-
219
-
220
-
221
-
222
-
223
-
224
-
225
-
226
-
227
-
228
-
229
-
230
-
231
-
232
-
233
-
234
-
235
-
236
-
237
-
238
-
239
-
240
-
241
-
242
-
243
-
244
-
245
-
246
-
247
-
248
-
249
-
250
-
251
-
252
-
253
-
254
-
255
-
256
-
257
-
258
-
259
-
260
-
261
-
262
-
263
-
264
 |
 |

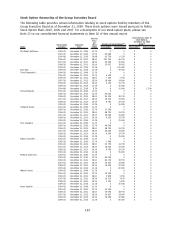
Share Ownership of the Group Executive Board
The following table sets forth the share ownership, as well as potential ownership interest through
the holding of equitybased incentives, of the members of the Group Executive Board as at
December 31, 2009.
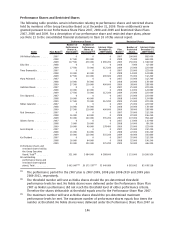
Shares
Shares
Receivable
Through Stock
Options
Shares
Receivable
Through
Performance
Shares at
Threshold
(3)
Shares
Receivable
Through
Performance
Shares at
Maximum
(4)
Shares
Receivable
Through
Restricted
Shares
Number of equity instruments held
by Group Executive Board........ 1179209 3032410 521000 2084000 1151000
% of the shares
(1)
................ 0.0318 0.0818 0.0140 0.0562 0.0310
% of the total outstanding equity
incentives (per instrument)
(2)
..... — 13.326 10.228 10.228 12.269
(1)
The percentage is calculated in relation to the outstanding number of shares and total voting
rights of the company, excluding shares held by Nokia Group.
(2)
The percentage is calculated in relation to the total outstanding equity incentives per instrument,
i.e., stock options, performance shares and restricted shares, as applicable, under the global
equity plans.
(3)
No Nokia shares were delivered under Nokia Performance Share Plan 2007 as Nokia’s performance
did not reach the threshold level of either performance criteria. Therefore the shares deliverable
at threshold equals zero for the performance share plan 2007.
(4)
No Nokia shares were delivered under Nokia Performance Share Plan 2007 as Nokia’s performance
did not reach the threshold level of either performance criteria. Therefore the shares deliverable
at maximum equals zero for Nokia Performance Share Plan 2007. At maximum performance under
the performance share plan 2008 and 2009, the number of shares deliverable equals four times
the number of performance shares at threshold.
The following table sets forth the number of shares and ADSs in Nokia (not including stock options or
other equity awards that are deemed as being beneficially owned under the applicable SEC rules) held
by members of the Group Executive Board as at December 31, 2009.
Name Shares ADSs
OlliPekka Kallasvuo .................................................. 383555 —
EskoAho........................................................... — —
Timo Ihamuotila ..................................................... 47159 —
Mary McDowell ...................................................... 127906 5000
Hallstein Moerk ...................................................... 64526 —
Tero Ojanpera
¨....................................................... 55826 —
Niklas Savander ..................................................... 71165 —
Richard Simonson .................................................... 158841 30557
Alberto Torres ....................................................... 41410 —
Anssi Vanjoki........................................................ 125514 —
Kai O
¨ista
¨mo
¨......................................................... 67750 —
Mr. Andersson left the Group Executive Board as of September 30, 2009 to head Nokia Corporate
Alliances and Business Development. He held 69 855 shares on September 30, 2009. Mr. Beresford
Wylie left the Group Executive Board as of September 30, 2009 and ceased employment with Nokia
Siemens Networks on November 1, 2009. He held 87 547 shares on September 30, 2009.
143