Nokia 2009 Annual Report Download - page 188
Download and view the complete annual report
Please find page 188 of the 2009 Nokia annual report below. You can navigate through the pages in the report by either clicking on the pages listed below, or by using the keyword search tool below to find specific information within the annual report.-
 1
1 -
2
-
3
-
4
-
5
-
6
-
7
-
8
-
9
-
10
-
11
-
12
-
13
-
14
-
15
-
16
-
17
-
18
-
19
-
20
-
21
-
22
-
23
-
24
-
25
-
26
-
27
-
28
-
29
-
30
-
31
-
32
-
33
-
34
-
35
-
36
-
37
-
38
-
39
-
40
-
41
-
42
-
43
-
44
-
45
-
46
-
47
-
48
-
49
-
50
-
51
-
52
-
53
-
54
-
55
-
56
-
57
-
58
-
59
-
60
-
61
-
62
-
63
-
64
-
65
-
66
-
67
-
68
-
69
-
70
-
71
-
72
-
73
-
74
-
75
-
76
-
77
-
78
-
79
-
80
-
81
-
82
-
83
-
84
-
85
-
86
-
87
-
88
-
89
-
90
-
91
-
92
-
93
-
94
-
95
-
96
-
97
-
98
-
99
-
100
-
101
-
102
-
103
-
104
-
105
-
106
-
107
-
108
-
109
-
110
-
111
-
112
-
113
-
114
-
115
-
116
-
117
-
118
-
119
-
120
-
121
-
122
-
123
-
124
-
125
-
126
-
127
-
128
-
129
-
130
-
131
-
132
-
133
-
134
-
135
-
136
-
137
-
138
-
139
-
140
-
141
-
142
-
143
-
144
-
145
-
146
-
147
-
148
-
149
-
150
-
151
-
152
-
153
-
154
-
155
-
156
-
157
-
158
-
159
-
160
-
161
-
162
-
163
-
164
-
165
-
166
-
167
-
168
-
169
-
170
-
171
-
172
-
173
-
174
-
175
-
176
-
177
-
 178
178 -
 179
179 -
 180
180 -
 181
181 -
 182
182 -
 183
183 -
 184
184 -
 185
185 -
 186
186 -
 187
187 -
 188
188 -
 189
189 -
 190
190 -
 191
191 -
 192
192 -
 193
193 -
 194
194 -
 195
195 -
 196
196 -
 197
197 -
 198
198 -
199
-
200
-
201
-
202
-
203
-
204
-
205
-
206
-
207
-
208
-
209
-
210
-
211
-
212
-
213
-
214
-
215
-
216
-
217
-
218
-
219
-
220
-
221
-
222
-
223
-
224
-
225
-
226
-
227
-
228
-
229
-
230
-
231
-
232
-
233
-
234
-
235
-
236
-
237
-
238
-
239
-
240
-
241
-
242
-
243
-
244
-
245
-
246
-
247
-
248
-
249
-
250
-
251
-
252
-
253
-
254
-
255
-
256
-
257
-
258
-
259
-
260
-
261
-
262
-
263
-
264
 |
 |
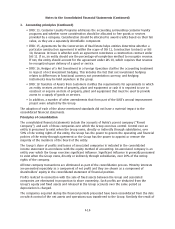
1. Accounting principles (Continued)
Property, plant and equipment
Property, plant and equipment are stated at cost less accumulated depreciation. Depreciation is
recorded on a straightline basis over the expected useful lives of the assets as follows:
Buildings and constructions ................................. 2033years
Production machinery, measuring and test equipment . ........... 13years
Other machinery and equipment ............................. 310years
Land and water areas are not depreciated.
Maintenance, repairs and renewals are generally charged to expense during the financial period in
which they are incurred. However, major renovations are capitalized and included in the carrying
amount of the asset when it is probable that future economic benefits in excess of the originally
assessed standard of performance of the existing asset will flow to the Group. Major renovations are
depreciated over the remaining useful life of the related asset. Leasehold improvements are
depreciated over the shorter of the lease term or useful life.
Gains and losses on the disposal of fixed assets are included in operating profit/loss.
Leases
The Group has entered into various operating leases, the payments under which are treated as rentals
and recognized in the profit and loss account on a straightline basis over the lease terms unless
another systematic approach is more representative of the pattern of the user’s benefit.
Inventories
Inventories are stated at the lower of cost or net realizable value. Cost is determined using standard
cost, which approximates actual cost on a FIFO (Firstin Firstout) basis. Net realizable value is the
amount that can be realized from the sale of the inventory in the normal course of business after
allowing for the costs of realization.
In addition to the cost of materials and direct labor, an appropriate proportion of production
overhead is included in the inventory values.
An allowance is recorded for excess inventory and obsolescence based on the lower of cost or net
realizable value.
Financial assets
The Group has classified its financial assets as one of the following categories: availableforsale
investments, loans and receivables, financial assets at fair value through profit or loss and bank and
cash.
Availableforsale investments
The Group classifies the following investments as availableforsale based on the purpose for
acquiring the investments as well as ongoing intentions: (1) highly liquid, interestbearing
investments with maturities at acquisition of less than 3 months, which are classified in the balance
sheet as current availableforsale investments, cash equivalents, (2) similar types of investments as
in category (1), but with maturities at acquisition of longer than 3 months, classified in the balance
sheet as current availableforsale investments, liquid assets, (3) investments in technology related
publicly quoted equity shares, or unlisted private equity shares and unlisted funds, classified in the
balance sheet as noncurrent availableforsale investments.
F14
Notes to the Consolidated Financial Statements (Continued)