Nokia 2009 Annual Report Download - page 230
Download and view the complete annual report
Please find page 230 of the 2009 Nokia annual report below. You can navigate through the pages in the report by either clicking on the pages listed below, or by using the keyword search tool below to find specific information within the annual report.-
 1
1 -
2
-
3
-
4
-
5
-
6
-
7
-
8
-
9
-
10
-
11
-
12
-
13
-
14
-
15
-
16
-
17
-
18
-
19
-
20
-
21
-
22
-
23
-
24
-
25
-
26
-
27
-
28
-
29
-
30
-
31
-
32
-
33
-
34
-
35
-
36
-
37
-
38
-
39
-
40
-
41
-
42
-
43
-
44
-
45
-
46
-
47
-
48
-
49
-
50
-
51
-
52
-
53
-
54
-
55
-
56
-
57
-
58
-
59
-
60
-
61
-
62
-
63
-
64
-
65
-
66
-
67
-
68
-
69
-
70
-
71
-
72
-
73
-
74
-
75
-
76
-
77
-
78
-
79
-
80
-
81
-
82
-
83
-
84
-
85
-
86
-
87
-
88
-
89
-
90
-
91
-
92
-
93
-
94
-
95
-
96
-
97
-
98
-
99
-
100
-
101
-
102
-
103
-
104
-
105
-
106
-
107
-
108
-
109
-
110
-
111
-
112
-
113
-
114
-
115
-
116
-
117
-
118
-
119
-
120
-
121
-
122
-
123
-
124
-
125
-
126
-
127
-
128
-
129
-
130
-
131
-
132
-
133
-
134
-
135
-
136
-
137
-
138
-
139
-
140
-
141
-
142
-
143
-
144
-
145
-
146
-
147
-
148
-
149
-
150
-
151
-
152
-
153
-
154
-
155
-
156
-
157
-
158
-
159
-
160
-
161
-
162
-
163
-
164
-
165
-
166
-
167
-
168
-
169
-
170
-
171
-
172
-
173
-
174
-
175
-
176
-
177
-
178
-
179
-
180
-
181
-
182
-
183
-
184
-
185
-
186
-
187
-
188
-
189
-
190
-
191
-
192
-
193
-
194
-
195
-
196
-
197
-
198
-
199
-
200
-
201
-
202
-
203
-
204
-
205
-
206
-
207
-
208
-
209
-
210
-
211
-
212
-
213
-
214
-
215
-
216
-
217
-
218
-
219
-
 220
220 -
 221
221 -
 222
222 -
 223
223 -
 224
224 -
 225
225 -
 226
226 -
 227
227 -
 228
228 -
 229
229 -
 230
230 -
 231
231 -
 232
232 -
 233
233 -
 234
234 -
 235
235 -
 236
236 -
 237
237 -
 238
238 -
 239
239 -
 240
240 -
241
-
242
-
243
-
244
-
245
-
246
-
247
-
248
-
249
-
250
-
251
-
252
-
253
-
254
-
255
-
256
-
257
-
258
-
259
-
260
-
261
-
262
-
263
-
264
 |
 |

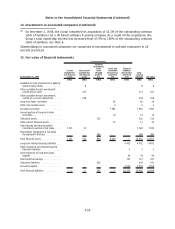
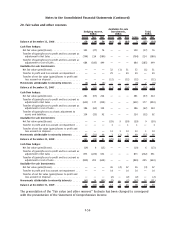
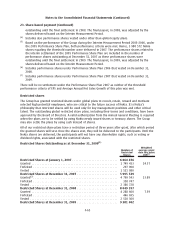
20. Fair value and other reserves
Gross Tax Net Gross Tax Net Gross Tax Net
Hedging reserve,
EURm
Availableforsale
Investments,
EURm
Total,
EURm
Balance at December 31, 2006 ................. 69 (19) 50 (66) 2 (64) 3 (17) (14)
Cash flow hedges:
Net fair value gains/(losses) . . . ................ 103 (27) 76 — — — 103 (27) 76
Transfer of (gains)/losses to profit and loss account as
adjustment to Net Sales .................... (794) 214 (580) — — — (794) 214 (580)
Transfer of (gains)/losses to profit and loss account as
adjustment to Cost of Sales . . ................ 684 (185) 499 — — — 684 (185) 499
Availableforsale Investments:
Net fair value gains/(losses) . . . ................ — — — 32 (1) 31 32 (1) 31
Transfer to profit and loss account on impairment . . . — — — 29 — 29 29 — 29
Transfer of net fair value (gains)/losses to profit and
loss account on disposal .................... — — — (12) — (12) (12) — (12)
Movements attributable to minority interests ..... (8) 2 (6) — — — (8) 2 (6)
Balance at December 31, 2007 ................. 54 (15) 39 (17) 1 (16) 37 (14) 23
Cash flow hedges:
Net fair value gains/(losses) . . . ................ 281 (67) 214 — — — 281 (67) 214
Transfer of (gains)/losses to profit and loss account as
adjustment to Net Sales .................... (631) 177 (454) — — — (631) 177 (454)
Transfer of (gains)/losses to profit and loss account as
adjustment to Cost of Sales . . ................ 186 (62) 124 — — — 186 (62) 124
Transfer of (gains)/losses as a basis adjustment to
assets and liabilities . . ..................... 124 (32) 92 — — — 124 (32) 92
Availableforsale Investments:
Net fair value gains/(losses) . . . ................ — — — (29) 9 (20) (29) 9 (20)
Transfer to profit and loss account on impairment . . . — — — 1 — 1 1 — 1
Transfer of net fair value (gains)/losses to profit and
loss account on disposal .................... — — — 13 1 14 13 1 14
Movements attributable to minority interests ..... 87 (21) 66 3 (1) 2 90 (22) 68
Balance at December 31, 2008 ................. 101 (20) 81 (29) 10 (19) 72 (10) 62
Cash flow hedges:
Net fair value gains/(losses) . . . ................ (19) 6 (13) — — — (19) 6 (13)
Transfer of (gains)/losses to profit and loss account as
adjustment to Net Sales .................... 873 (222) 651 — — — 873 (222) 651
Transfer of (gains)/losses to profit and loss account as
adjustment to Cost of Sales . . ................ (829) 205 (624) — — — (829) 205 (624)
Availableforsale Investments:
Net fair value gains/(losses) . . . ................ — — — 36 (4) 32 36 (4) 32
Transfer to profit and loss account on impairment . . . — — — 14 — 14 14 — 14
Transfer of net fair value (gains)/losses to profit and
loss account on disposal .................... — — — (2) — (2) (2) — (2)
Movements attributable to minority interests ..... (65) 16 (49) (2) — (2) (67) 16 (51)
Balance at December 31, 2009 ................. 61 (15) 46 17 6 23 78 (9) 69
The presentation of the “Fair value and other reserves” footnote has been changed to correspond
with the presentation of the Statement of Comprehensive Income.
F56
Notes to the Consolidated Financial Statements (Continued)